
4-lepton analysis for Higgs@10
This explanation was made for Ver 1. Some of the details vary from Ver 2.
A note of explanation
This page is intended for teachers who are exploring the new (as of June 2022) Higgs discovery activity Higgs@10 workshop.
We are looking for the Higgs boson via the H → ZZ (Higgs to two Z bosons) decay channel:
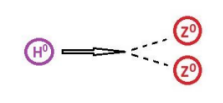
That means, to find the Higgs, we are really looking for Z bosons. We will look at decays of Z particles into electrons or muons, as these are simplest to analyze:
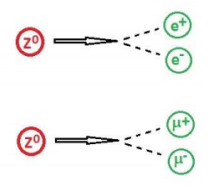
Thus a Higgs event in this scenario shows up as 4 leptons:
- 4 muons, or
- 4 electrons, or
- a combination of 2 muons and 2 electrons.
Before we look at the Higgs, then, we ask: What, besides the Higgs, can produce 4 leptons?
How about 2 independent Z bosons? If a Z boson has a mass of about 90 GeV, where on a mass plot would we find ZZ?
What if a Z boson decays to two leptons but one of the leptons radiates a photon (γ)? If the photon pair produces to two leptons. we get 4 leptons in total, like this:
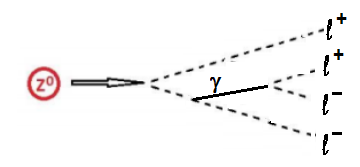
Where would this show up on a mass plot?
Our job, then, is to find a 4-lepton signal that is not ZZ or Zγ in a mass plot we will generate from actual CMS data. If we find it, that might be a signal of the Higgs!
Part I: Find Higgs candidates in iSpy.
Investigators will divide into pairs working together. Each pair will look at a dataset in the N5 group in iSpy:
- Go to https://www.i2u2.org/elab/cms/ispy-webgl/.
- Choose the file folder icon at the top left; a window will pop up.
- In the pop-up, choose "Open files from the Web" and then "N5/"
- A list of 5 dataset will appear. choose one.
- A list of Events will appear in the right-hand column of the pop up. Choose the very first one (at the top) and then choose the Load button.
Now that you have an event, you will want to go from event to event looking for 4-muon events. Muons are very prominent long, red tracks and so they will be easy to see. .When you find one, click the 4 muon tracks, one-by-one. They will turn gray as you do so. Once you have 4 gray tracks, press "m" on your keyboard and a mass in GeV will appear. That is the mass of whatever decayed into those. Hold onto that number. Want to do some more? Go for it! Get as many as you can in a short time! Be sure to write down the Run and Event number form the top and the mass found for each 4-muon event.
Part II. Analyze data in a spreadsheet.
We've prepared a spreadsheet for you and your partner to analyze results.You will find it at:
https://docs.google.com/spreadsheets/d/1eNUkQrHYCkeJ00DTkTvNUnNtvGELVaaBOD2jTfOWr6M/copy?usp=sharing.
This will bring you first to a page that invites you to make your own copy of the spreadsheet. Do that!
Once you open your sheet, go the the left tab, marked "iSpy data". Put the Run, Event, and Mass in a line (starting with Index 146) for each 4-muon event you have analyzed. That is not much data to make a mass plot, is it?
No worries! Copy everything you have just entered (including Index numbers) and go to the second tab, marked "OpenData". You will see 145 lines of data, a 4-lepton event on each line, complete with the energy and momentum for each lepton. It is from these 4-vectors that the mass of the parent object has been calculated for each and placed in the column marked "M (GeV)".
Scroll down to index 145. Paste your data just below, so the masses all line up.
Highlight all the numbers in the "M (GeV)" column and then go to Insert > Chart > Chart type > Other > Histogram chart. Add labels to your histogram, change bin widths, and manipulate it as you see fit to read the data.
- Do you see a peak that could be Zγ?
- Do you see a peak that could be ZZ? (It will start where you expect but smear out to the right.)
- Do you see any other peaks?