BAMC Masterclass Student Launch Page
Small URL for this page: http://cern.ch/go/8nH8.
BAMC in 4 Steps / 4 Screencasts
Introduction
Welcome to BAMC - Big Analysis of Muons in CMS. We will study interactions in the CMS Detector at CERN that result in:
All other interactions are to be considered background - perhaps interesting but not subjects of our research. Our purposes are to:
- find the ratio of W+ to W- events (from one muon and one neutrino)
- fiind the masses of parent particles - the particles that transform into 2 muons or 4 muons.
Set-Up
Your teacher will assign you a data file to study. Each file number will be of the form N.M. N refers to the Group the data file is in: N5, N10, N25, N50, or N100. M is the ordinal number after that to specify the exact data file in the group. Thus data file 5.2 is Group N5, 2nd file.
You will need to set-up iSpy and CIMA online.
Here is what you do to set up iSpy:
- Go to iSpy-wbgl. Best browsers to use: Chrome, Safari, Edge.
- Do not change any settings from the column on the left. [The screencast shows one change you can make there but it is not strictly necessary.]
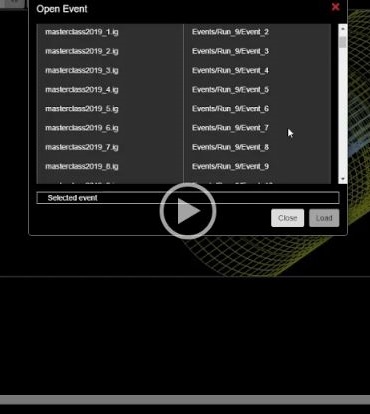
- Open the file folder at the upper left. This will open the "Open File" window.
- In the Open File window, choose "Open File(s) from the Web".
- This will give you a list of "N numbers" in the "Files" column. Choose the one that matches your assigned data file.
- The list under Files will change to a list of individual files, each of the form "masterclass2019_M.ig, except the M is an actual orfinal number - the second part of your data file number. Find your and choose it. [If your file is 5.2, then you chose N5 and then masterclass2019_2.ig.]
- A list will appear on the right side of the box under Events. Go to the topmost event ("EventsRunM/Event1" where M is your data file number) and choose it. Then choose the "Load" button at the bottom right of the box.
- You ar eread to start using iSpy.
Here is what you do to set up CIMA (CMS Instrument for Masterlcass Analysis):
- Go to CIMA-WZH. It loves all browsers.
- Find BAMC-02Apr2020 at or near the bottom of the list under "Choose your Masterclass" to the left. Choose it.
- A new list will appear toward the center of the page with the heading "Choose your location". Find your school with "2020" after it, e.g. "MillsGodwin2020". Choose that.
- Another list will appear to the right with data file numbers under "Choose your data file". Find your data file and choose it.
You are ready to start.
Do the Measurement
You shoild now have iSpy and CIMA open, both on the first event of the same data file, e.g. 5.2.
Check out iSpy. In the buttons at the top of iSpy, you will see three buttons that look like little xyz coordinate systems. The first is for the YX view.. Choose this to get the cutaway view of the cylindrical detector. The other two are for side views but the YX view is the most useful of the three and should be sort of your "home base". You can rotate the view almost any direction by dragging your cursor on the cylinder while pressing your (left) mouse button. You can zoom in or out using the magnifying glass buttons at the top. These are just about the only controls you need, aside from the arrows to go to the previous or next event. Play with it a bit to get used to it.
Let's measure data:
- In iSpy, make sure you are at event 1, YX view. You are looking for long, red tracks. These are from muons. Do you see 0, 1, 2, or 4 of these? [Note: there is sometimes also a purple or pink track for "missing energy". It can be important but it is not a muon.] Everyting in the event except the red muon tracks and the purple or pink missing energy track (in the case of one muon) is background to us. We can ignore it.
- If you see 0 (no) red tracks, go to CIMA, choose Zoo under "Primary State".
- If you see 1 muon, you should also see a purple or pink "missing energy" track. This indicates a possible neutrino. If (and only if) you do not see the missing energy track, choose Zoo under "Primary State". If you do see a missing energy track, the you have a little more work to do before visiting CIMA:
- In the YX view take a close look at the muon track. It should curve clockwise or counterclockwise. You might want to use a straight edge to figure this out.
- If the red track curves clockwise, the muon has a positive charge (technically, it is an antimuon) and it, along with the neutrino, came from a W+ particle that decayed. In CIMA, choose μν under "Final State" and W+ under "Primary State" and "Charged Particle". Then choose the Next button. (Do not enter a mass.)
- If the red track curves counter-clockwise, the muon has a negative charge and it, along with the neutrino, came from a W- particle that decayed. In CIMA, choose μν under "Final State" and W- under "Primary State" and "Charged Particle". Then choose the Next button. (Do not enter a mass.)
- Sometimes, you cannot tell the curvature because the red track is just too straight. In that case, go to CIMA and choose μν under "Final State" and W± under "Primary State" and "Charged Particle". Then choose the Next button. (Do not enter a mass.)
- If you see two muons, it is possible that the two muons came from the decay of a single particle. We can measure the mass by measuring the muons:
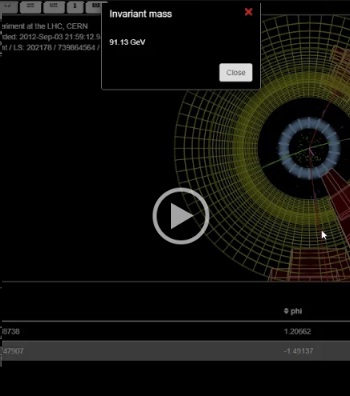
- Bring your cursor close to one of the red tracks. When it turns gray, (left) click your mouse. Do the same for the other track. Then press "m" on your keyboard. A box should pop up with a mass. You need that number.
- Go to CIMA and choose μμ under "Final State". Then choose Neutral Particle (Z, H) under "Primary State". Type the mass (number only, no text) in the box under "Enter Mass" and choose the Next button.
- If you see four muons, it is possible that the four muons came from the decay of a single particle. We can measure the mass by measuring the muons:
- Bring your cursor close to one of the red tracks. When it turns gray, (left) click your mouse. Do the same for the other three tracks. Then press "m" on your keyboard. A box should pop up with a mass. You need that number.
- Go to CIMA and choose 4μ under "Final State". Then choose Neutral Particle (Z, H) under "Primary State". Type the mass (number only, no text) in the box under "Enter Mass" and choose the Next button.
- Any event that is not described above is a Zoo event.
Go make sure you are on Event 2 in both iSpy and CIMA and start all over again. You have 100 events in your data file. Try to get as many analyzed as you can (statistics are important) but do not worry if you do not get them all done. You do not want to rush either - the quality of your measurement is important too.
Wrap-Up
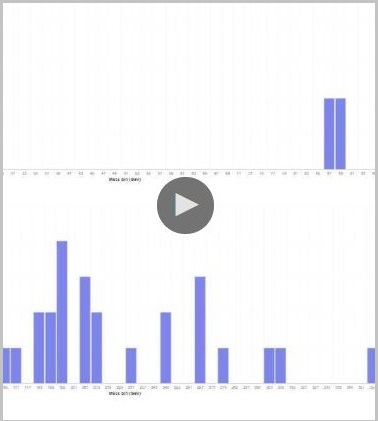
Once you have finished your analysis, take a look at the tabs at the top of CIMA. You have been in the Events Table. In the Mass Histogram, you will see two plots. The one at the top shows two-muon events from the whole,masterclass - your events and everyone those from everyomne else from your school. As a histogram, it wiill show hom many events are in each "bin" of 2 GeV mass width. If you see a peak just above, for example, 3 GeV on the horizontal axis, that means there were a lot of events in the 2 GeV band centered on 3 GeV (2-4 GeV). If the peak is pretty tall above background, it might indicate that there was a Primary State Neutral Particle in that mass range that was made often and decyed into two muons. You might find other peaks as well.
The plot at the bottom is the four-muon plot. It shows how many events were in each 6 GeV wide bin. There, too, we hope to find peaks to indicate particles.
The other tab is Results. This shows a summary of all the events analyzed in the masterclass by you and your fellow students from your school. At the bottom is Ratios. You can see a ratio of electrons to muons - meaningless here as we are not looking at electrons. However, there is also a W+ to W- ratio. That is interesting. What do you expect it to be?
At the end of the data analysis, we will have a videoconference in which we will look at the Mass Histograms and Results in combination from all schools and students in the BAMC masterclass. We hope that will be pretty interesting.


