How to linearize a curved data plot
Adapted from Graphical Methods Summary - Modeling Instruction - AMTA. Also, thanks to Jane Nelson, Orlando, FL, for the memorable naming of graph shapes.
If your data graphs as a curve, the variables you have plotted have a non-linear mathematical form or relationship. Non-linear data is mathematically difficult to analyze. However, if we can convert the data to a linear (straight) form we can use our knowledge of straight lines to learn about the physics involved in our experiment. So, if we are confronted with non-linear (curved) data then our goal is to convert the data to a linear (straight) form that can be easily analyzed. This process is called linearization.
There are four possibilities for graph shapes that we will deal with. Each shape represents data that exhibits a different mathematical form.
|
|
|
|
|
| Linear – Our Goal! | Over-achiever | Under-achiever | Non-conformist |
|
Mathematical form: y = mx + b or y = kx |
Mathematical form: y = x2 |
Mathematical form: y = √x |
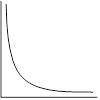
Mathematical form: y = 1/x or y = 1/x2 |
| Data is already linear. Draw a best fit line and calculate the slope. |
Make a new calculated column with the x-axis variable squared. (X = x2). Then plot y vs. X |
Make a new calculated column with the y-axis variable squared: (Y = y2). Then plot Y vs. x |
Make a new calculated column with the x-axis variable as 1/x or 1/x2 (X = 1/x or X = 1/x2). Then plot y vs. X |
- Make a new calculated column based on the mathematical form (shape) of your data.
- Plot a new graph using your new calculated column of data on one of your axes.
- If the new graph (using the calculated column) is straight, you have succeeded in linearizing your data.
- Draw a best fit line USING A RULER! DO NOT CONNECT DOTS!!
- Calculate the slope of your best fit line (with units) by selecting two points from the best fit line. Pick two points that are reasonably spaced (one near the beginning of the line and one near the end). Do not use data points.
- Write the equation of the best fit line using the real physical variables from your experiment. We call this equation the physics equation since it is written in the variables from our experiment.
- IMPORTANT POINTS:
- The slope of the physics equation may have an important physical meaning and is related to a quantity that remains constant throughout the experiment.
- The vertical intercept of the physics equation is the value of the vertical axis variable when the horizontal axis value is zero and will have the units of the vertical axis.