Friday Flyer - March 18, 2022
Spotlight on Muons in Mexico
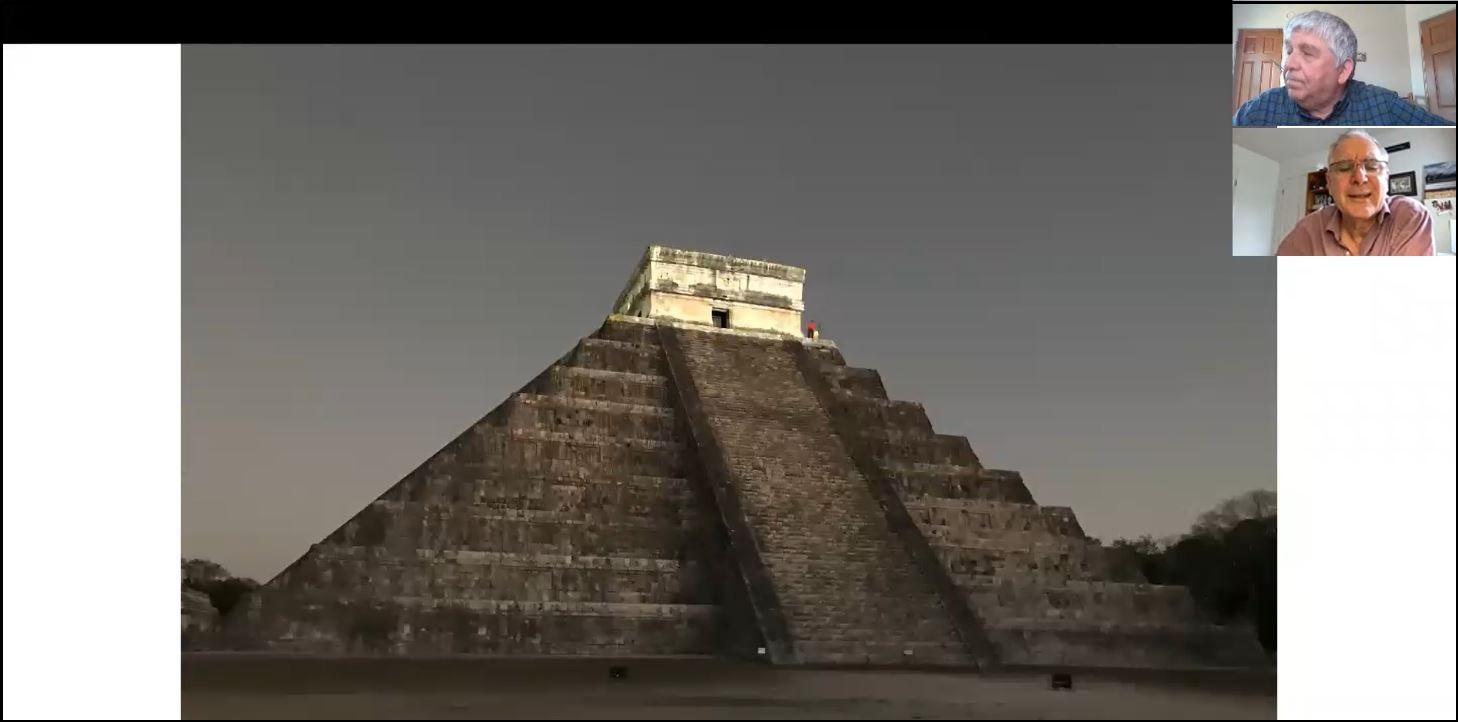
Do you remember the article about muon tomography of a pyramid in Egypt that we featured back in December? Well, staff member and mentor Mark Adams and his colleagues have noted, along with some archaeologists, that Mexico has cosmic ray muons and pyramids, too, so they designed an experiment to search for hidden chambers in a Mayan pyramid. While their specialized cosmic ray detector for this purpose is still under development, they recently made their first trip to Chichen Itza to take physical measurements and to get baseline data with a modified QuarkNet detector Not only was the expedition a success, but some of that baseline data is now available on the QuarkNet Cosmic Ray e-Lab. FF spoke with Mark about it: watch the video below.

News from QuarkNet Central
International Masterclasses are ongoing. Learn more in the most recent IMC circular. Not signed up yet? Time is running out, but it is still possible! Contact Ken Cecire, Spencer Pasero, or Shane Wood.
International Muon Week ends today. Look for a report in the Friday Flyer in the coming month.
QED fans: Remember that we are on hiatus until April 27, when we'll be back with an interesting and unique guest speaker.
QuarkNet teachers: We have special opportunities for you on a time-limited basis, this month only:
- A Spring Teacher Institute (already in progress)
- Special mini-grants to help you with your cosmic ray detector
- Stipends for participation in Masterclasses
Check out the information flyer and send your questions to Ken, Shane, or Mark.
Upcoming events and dates:
- Check out the European School Innovation Academy website for teacher training and international opportunities. The registration deadline is this coming Monday, March 21. Also, take a look at the European Galileo Teacher Training courses offered by NUCLIO. This still seems to be open for registration. Availability of these programs to teachers from the United States may vary; you will need to check.
- Beamline for Schools (BL4S) registration is open until April 15. In BL4S, teams of high school-age students propose their own experiments to run in a CERN beamline. The winning team(s) actually go to CERN to make their measurements with expenses paid by BL4S.
- The next Harvard PoLS-T Network monthly talk with live Q&A in support of high school physics education will be on April 2, 10-11 a.m. CDT. The event will feature Julie Jungalwala from Harvard University and the Institute for the Future of Learning, and the Q&A will be moderated by Eric Mazur. Interested? Register and learn more!
Physics Experiment Roundup
Even as we await the restart of the LHC, analysis from previous runs goes on. The CERN Bulletin reports on how ATLAS and CMS physicists are narrowing down the unobservable portion of the Higgs branching ratios.
APS Physics has some interesting reports. First, progress may be in the offing for heavy-ion colliders with a correction to smearing of particle distributions using techniques borrowed from optics. Also, optics provides a new idea for detecting theorized light dark matter. This one is bigger than LIGO: using the moon to detect gravitational waves. And, since we love neutrinos, let's see how solar neutrino detection is getting a boost.
Remember the Mpemba effect from QED and our February 4 issue? Well, according to Physics Today, it's back(wards).

Resources
Let's begin with two Fermilab videos. The first is How to do Big Science: Part II. You may recall that Part I was in the January 10 Friday Flyer. Next, liven up your physics class with the famous and popular Mr. Freeze. Also from Fermilab: a report on the Fermilab Open House.
Symmetry magazine contributes articles on How to Break a Theory and Building for Science and Society.
Everyone loves black holes — from at least a parsec away — and we're all fascinated by the paradox of Hawking radiation. The paradox is that, according to general relativity, nothing can escape a black hole, while quantum mechanics indicates something must escape. We learn from BBC News that this hairy dilemma can be solved with the concept of hairy black holes. (H/T Marge Bardeen.) Yes, you read that right.

Just for Fun
We had Fermilab bison a while back, and now we have a Fermilab prairie fire in Fermilab Today.
As you know, we have a serious daylight saving time situation under consideration at the highest levels. If this is the reminder you needed, it is a little late to set your clock, but go ahead anyway. We at One Friday Flyer Plaza will wait. Back? Good. Here is the xkcd solution.
Since baseball is back, let's review Casey at the Bat. And here it is read by Darth Vader (sort of), with irritating music to go with it. We have one more good version. OK, three strikes. We're out.
QuarkNet Staff
Mark Adams: adams@fnal.gov
Ken Cecire: kcecire@nd.edu
Spencer Pasero: spasero@fnal.gov
Shane Wood: swood5@nd.edu