Introduction
This CMS W and Z measurement uses a special set of events shown in the iSPy-webgl event display program from CMS. There are a 5 sets of 40 events: W candidates, Z candidates, and background. The W candidates decay into an electron and a neutrino or a muon and a neutrino. Neutrinos show up as missing tranverse energy. The Z candidates almost all decay to pairs of muons.
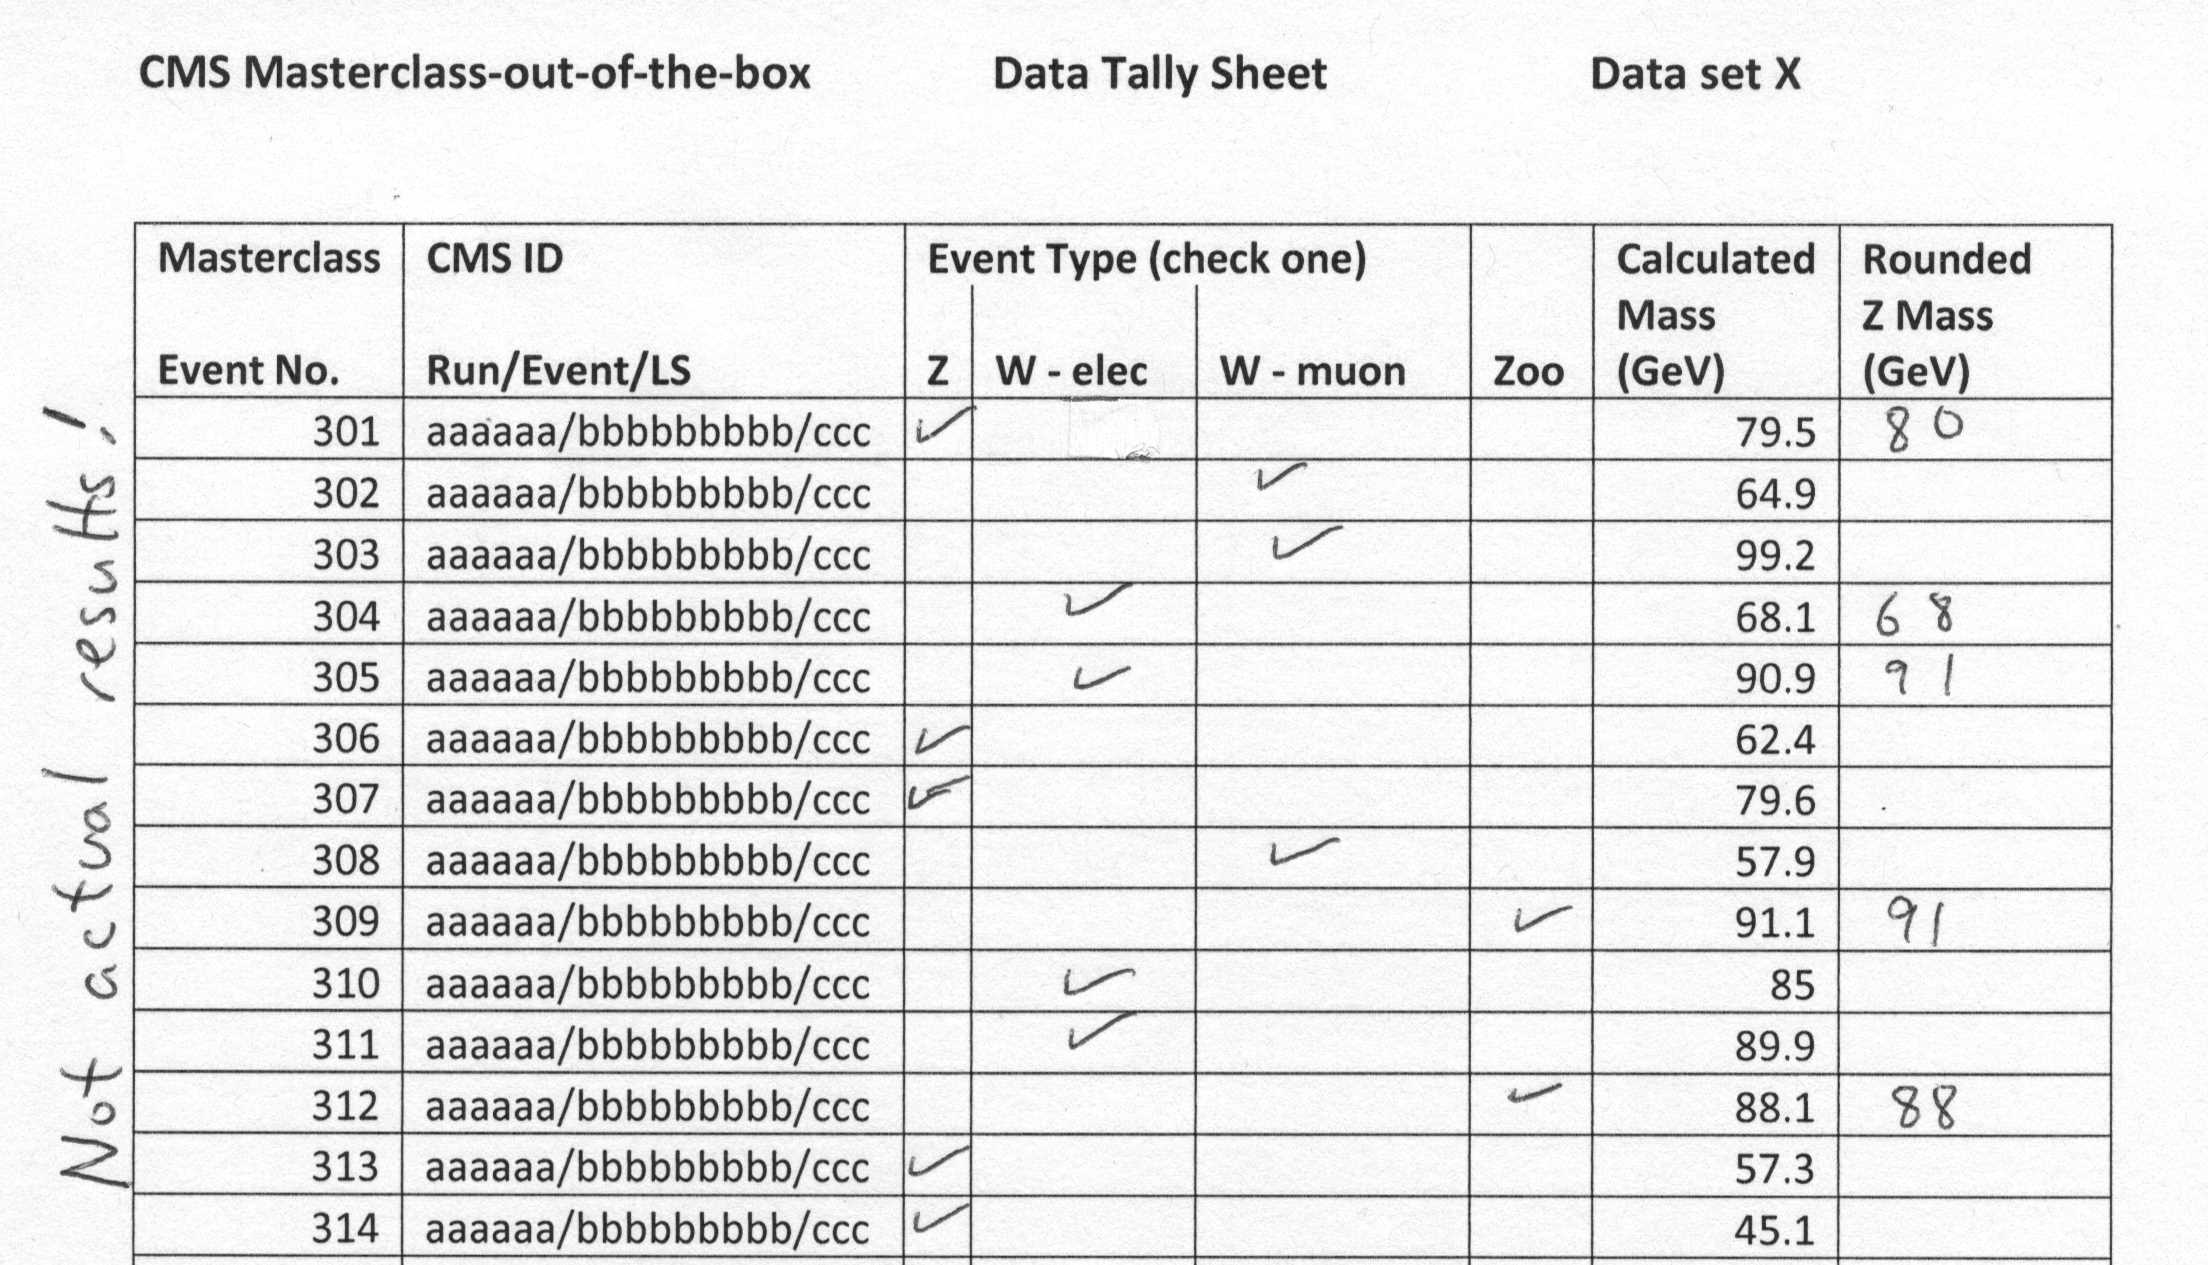
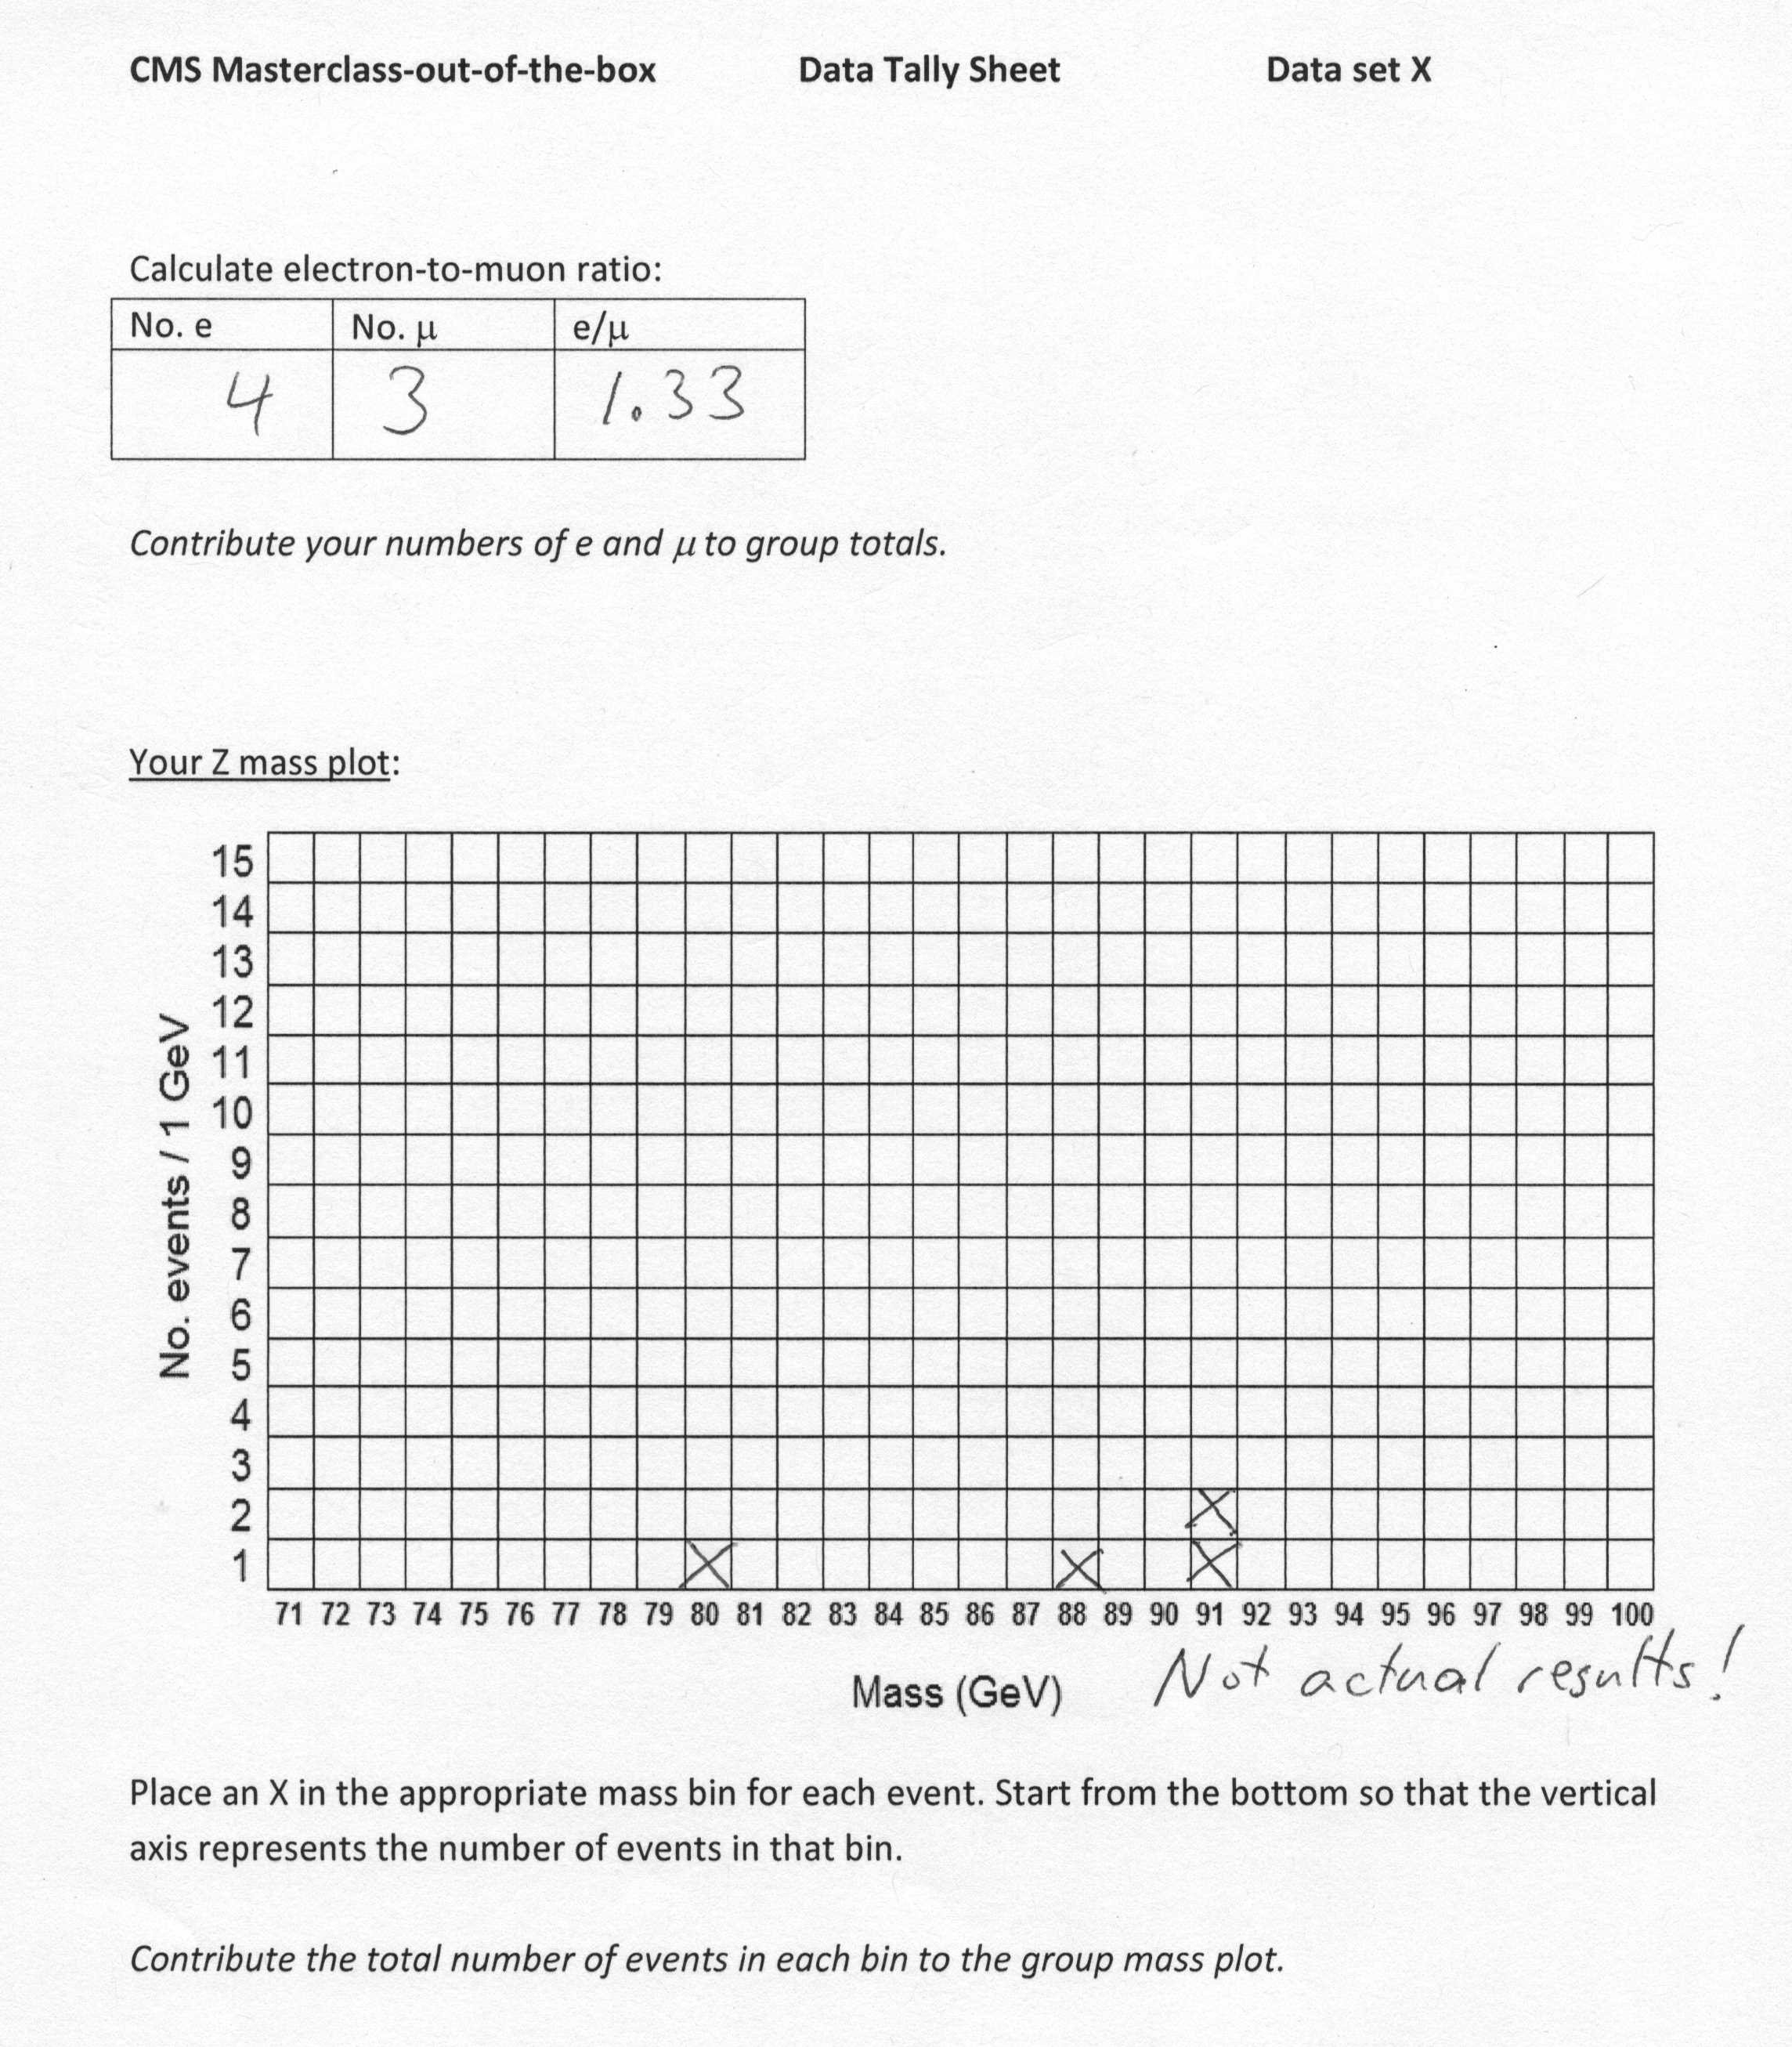
Each group of, optimally, 2-4 students is assigned an event set. Students decide which of the three types each event should be and record this in the tally sheet for their set. If the event is a W candidate, this is recorded along with whether it is a muon or an electron decay. Students will count muons vs electrons when finished and calculate e/μ in the space provided. If the event is a Z candidate, students make note of the mass, round it to the nearest whole number, and record it in the sheet. These values are then used to make a Z mass histogram on the graph space provided. When all students in the masterclass are finished, they will combine tier results into an overall mass plot and a best value of e/μ.
Objectives
After the masterclass activity students will be able to:
- Explain that a general-purpose collider detector is made of a number of subsystems and describe what they are designed to measure.
- Express an increased appreciation for the nature of scientific investigation.
- Identify specific particles and their decays by their signatures.
- Give examples of how bosons can decay into different types of leptons.
- Describe/show how conservation laws and energy-mass conversion apply to particle physics.
- Give examples of conservation of charge in particle decays.
Student goals
- Each small group of students examines a set of 40 events.
- Determine which events are W candidates, Z candidates, or background.
- Determine if W candidates are electron or muon decays. Determine e/μ to test lepton universality in pairs..
- Make mass plot from Z masses. Use to determine mass of Z boson in pairs.
- Each pair reports results and contributes to whole group mass plot and e/μ calculation.
- Discuss results and uncertainty in group.
Data analysis
Students form into pairs; each pair gets a set of 40 events in the form of a PDF file. They can examine these files on computers or the teacher/leader can print them. Each pair of students also gets a PDF data tally sheet - these do need to be printed.
| Event files | Tally sheets | Additional resources |
|---|---|---|
After the alloted time for data analysis (30-60 min), students should combine results. To combine Z mass results, the leader should put a mass plot in front of the group to which all can add their data. Students should also contribute their W→eν and W→μν totals to get an over class result for e/μ.
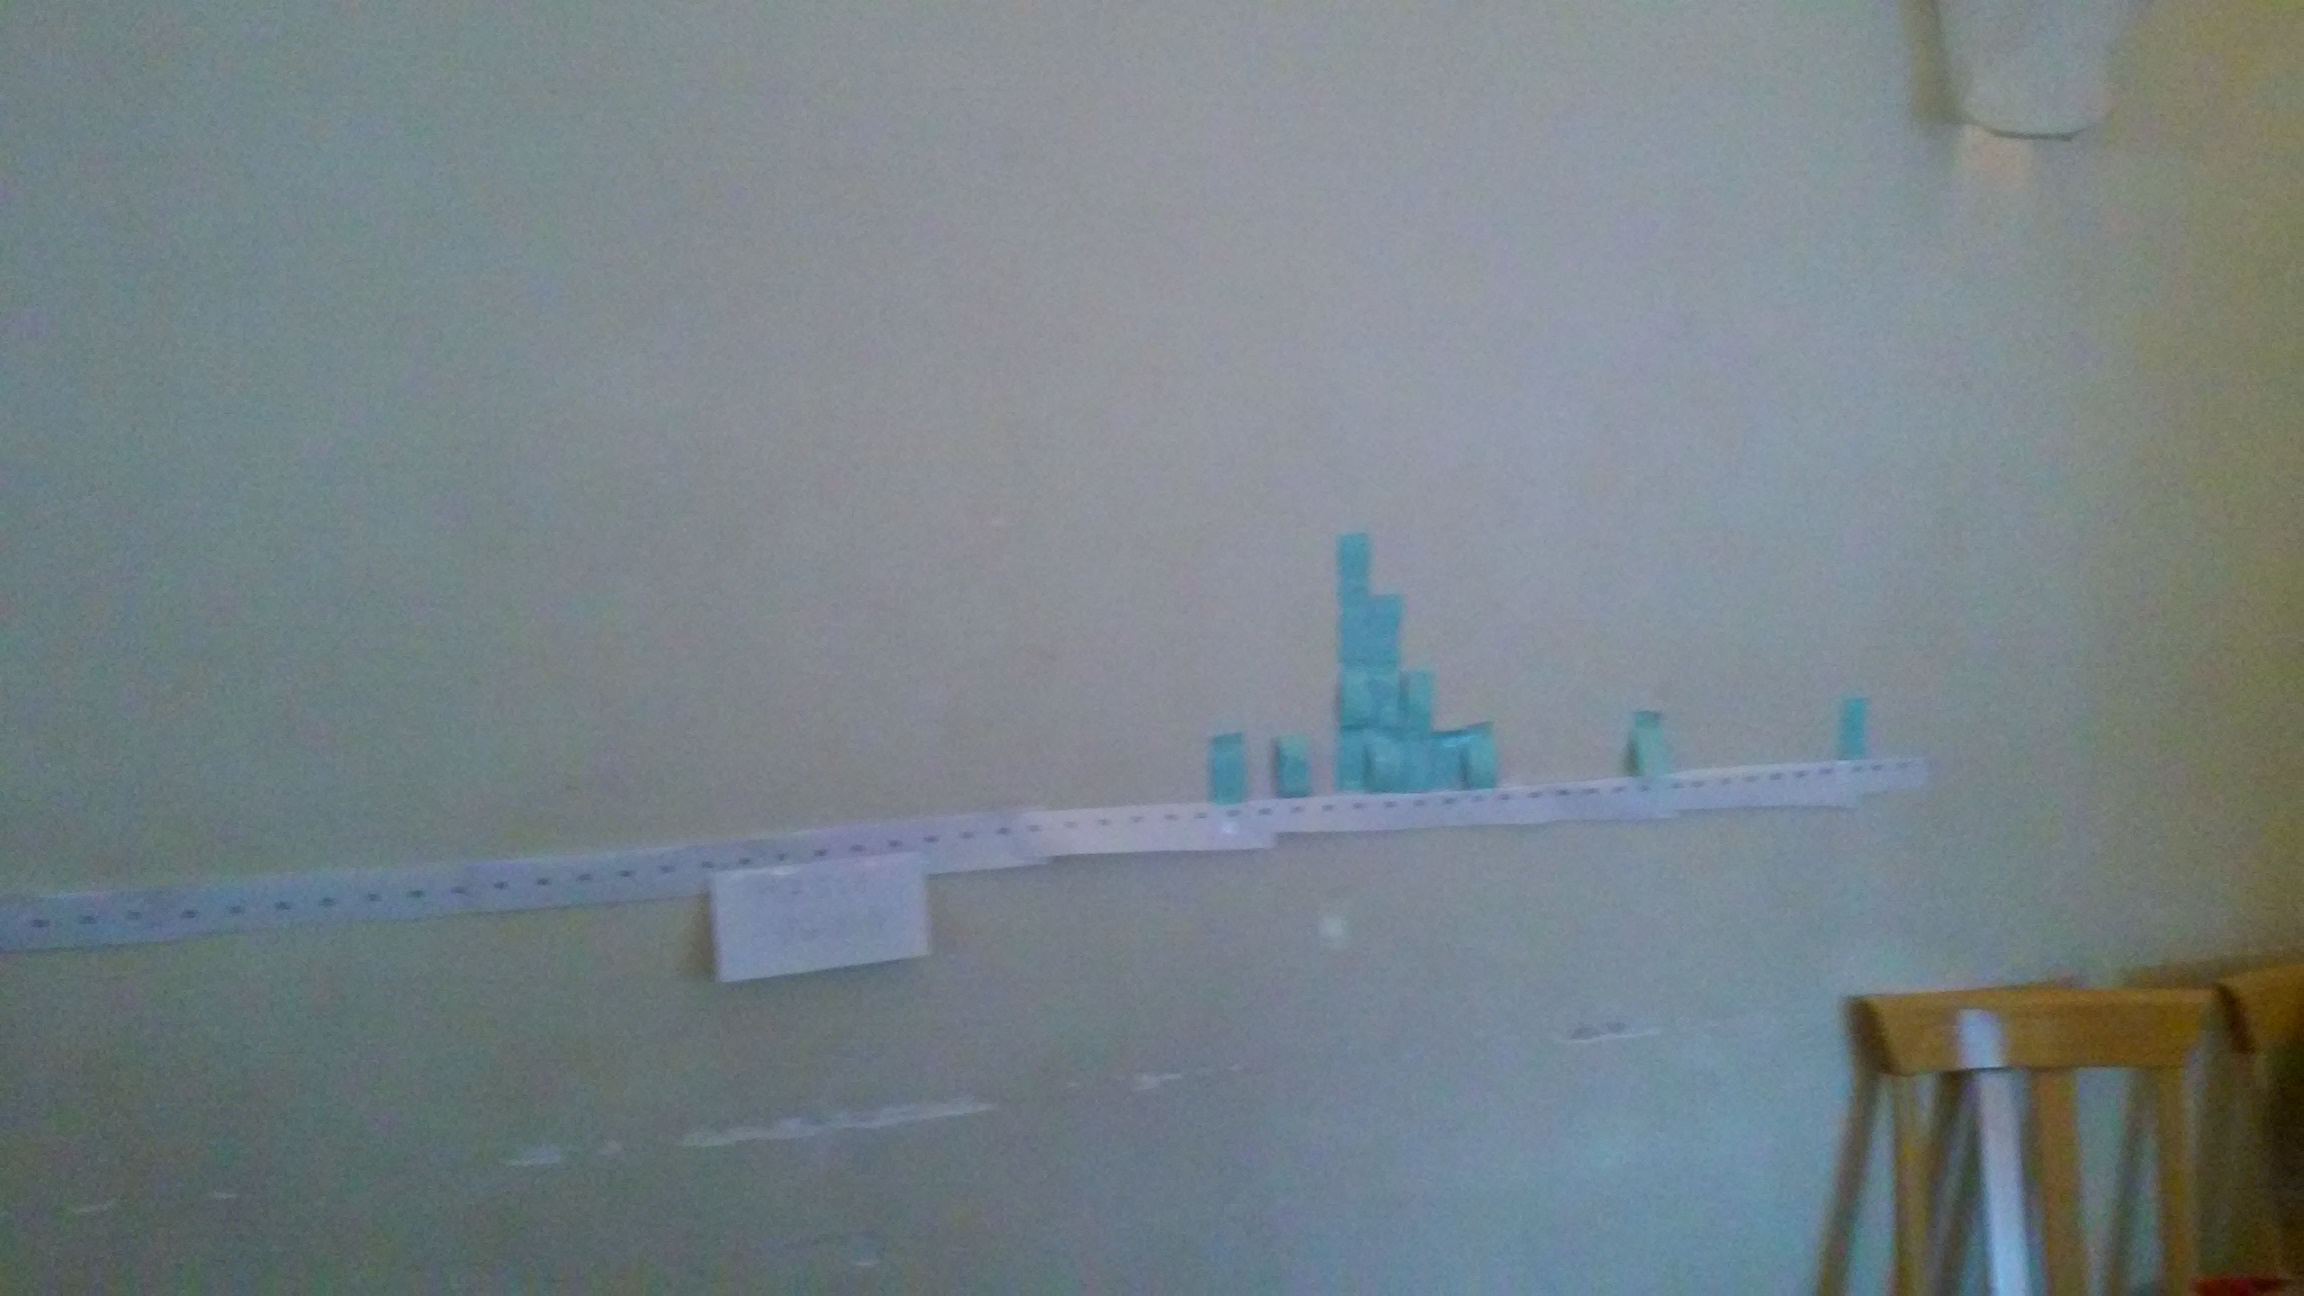
One way to make the Z mass plot is to use post-it notes on the wall; each student adds one note per Z candidate event from the tally sheet. |
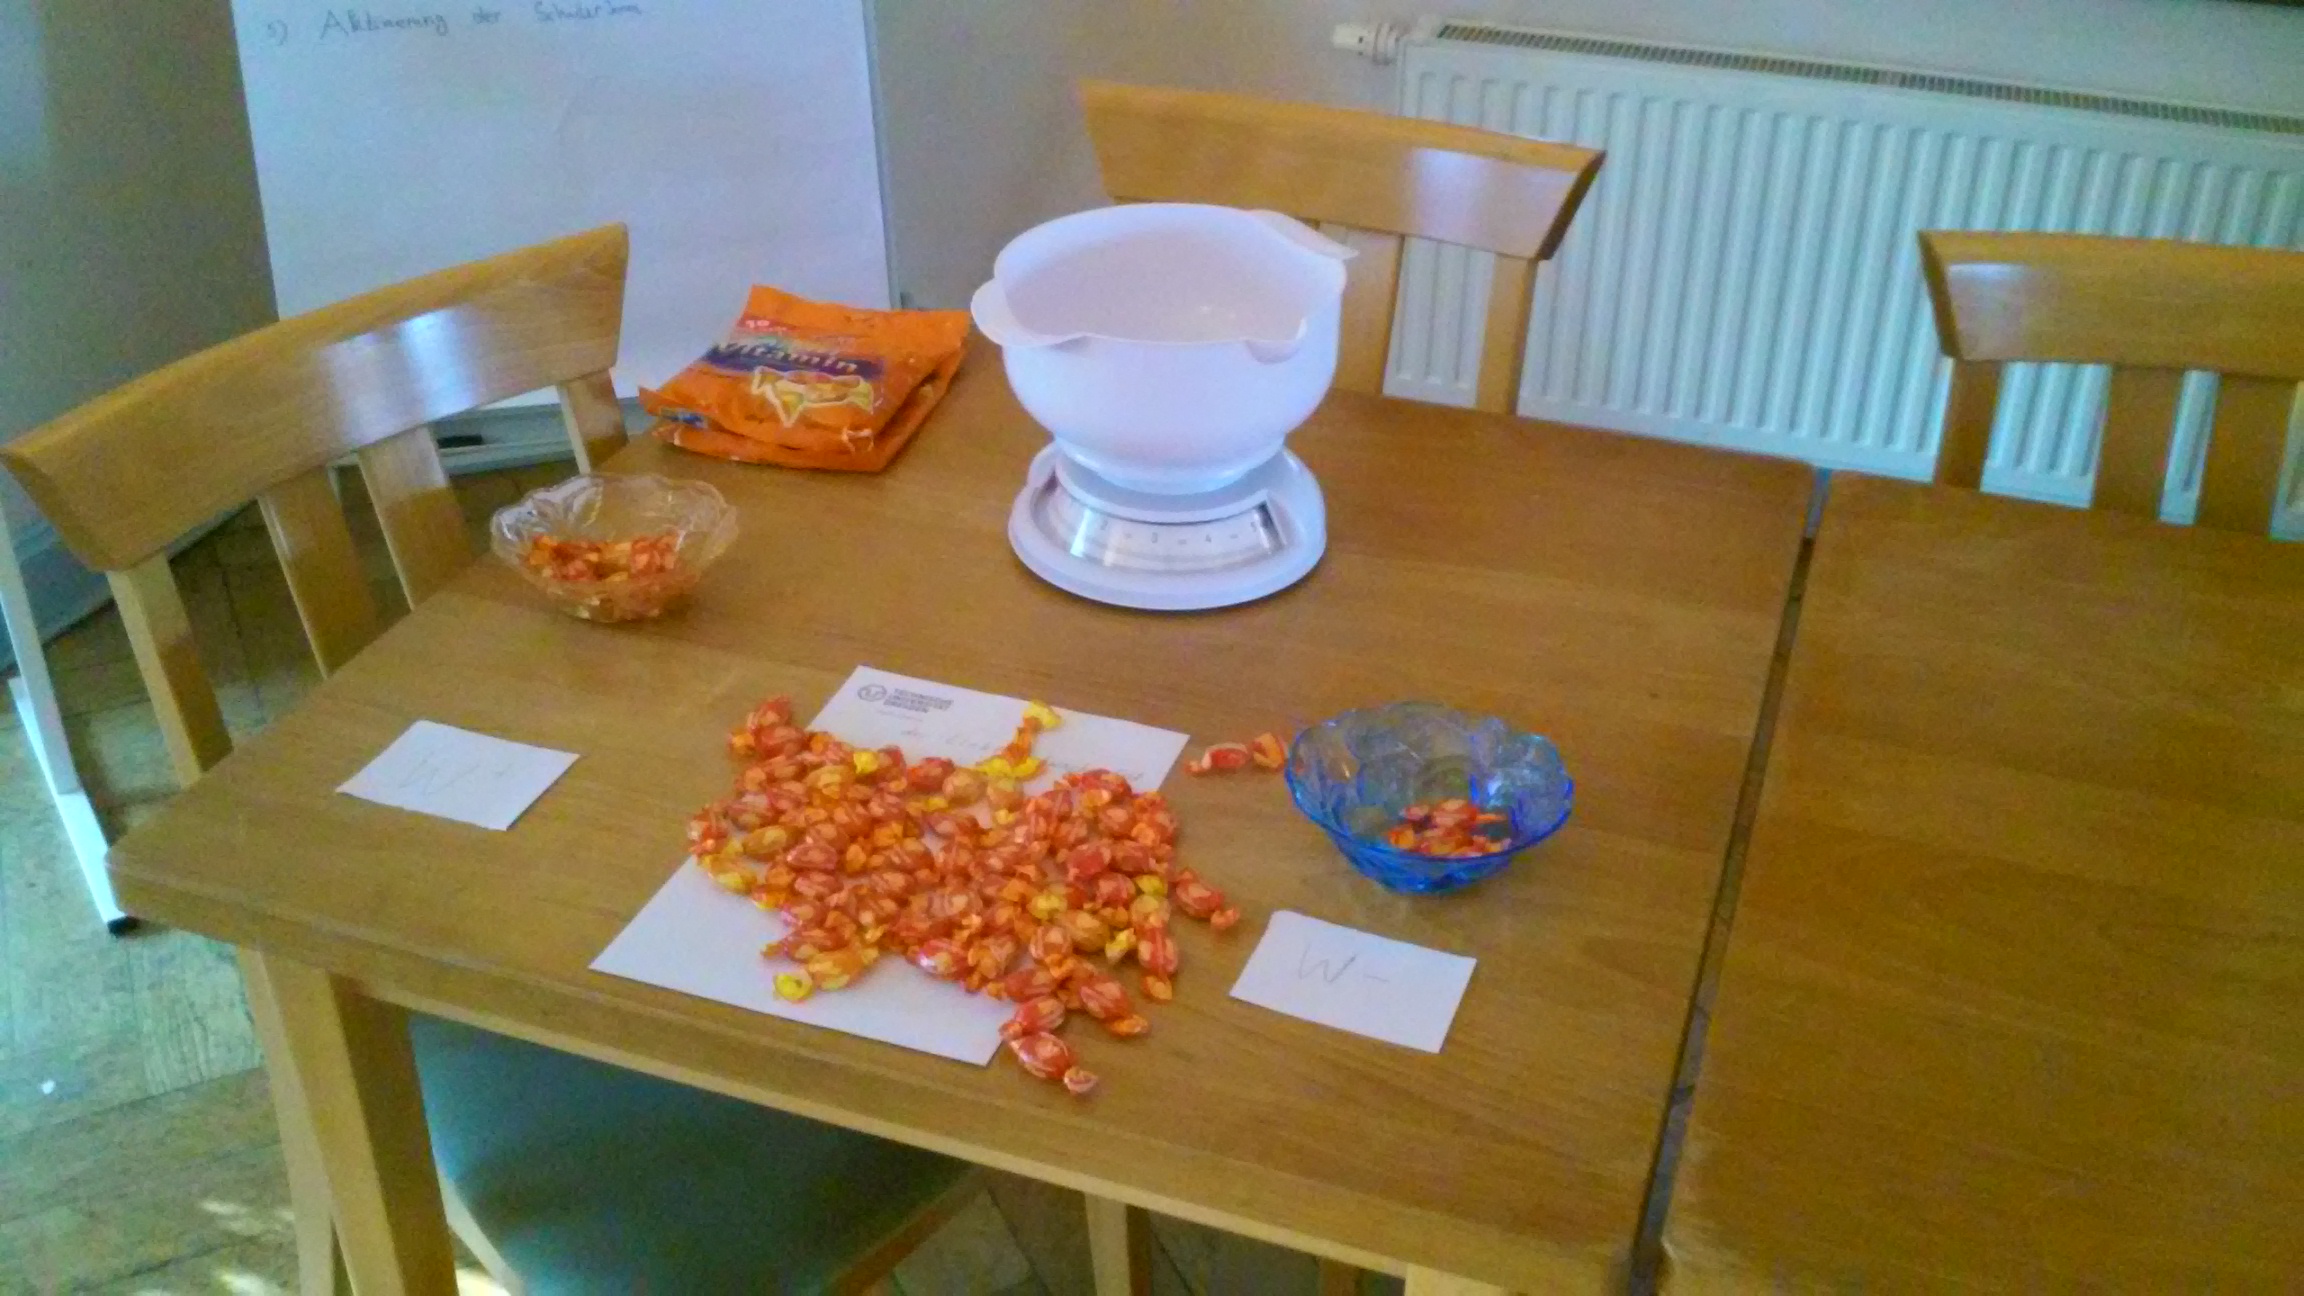
It is possible to take a creative approach to counting W events. Here, one hard candy stands in for one W candidate and the W count is taken using a scale. |
Annotated sample events
|
|
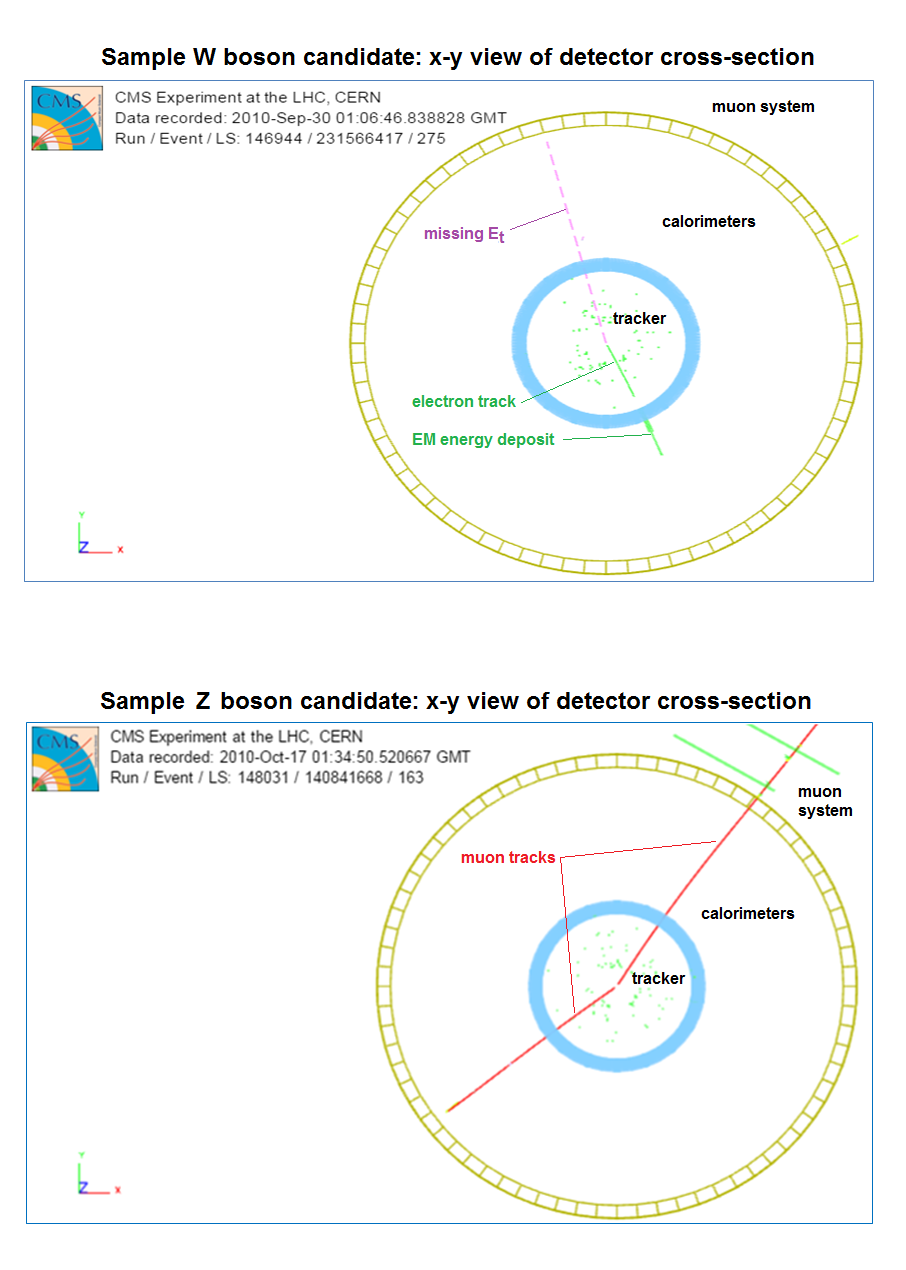
Events are shown in "xy-view". showing the roughly cylindrical CMS detector in a cross-section. The proton beams come from a line perpendicular to the page and intersecting the xy-view of the detector in the center. If the proton-proton collision yields a W boson, it promptly decays into either an electron (short green track matched with a green "energy tower" which indicates a deposit in the electromagentic calorimeter) or a muon (longer red track, often leading to muon "hits" in the outer muon system and a neutrino (shown as a dashed purple line for missing Et, which). If the collision creates a Z boson, this promptly decays into two muons. W and Z particles have other decays but they are not used in our sample. Anything which cannot be reasonably described as W→eν, W→μν, or Z→μμ is considered background. Students record W, Z, and background events in the tally sheet. For W candidates, students also record whether the events are W→eν or W→μν. They total these in the space provided and calculate e/μ. For Z candidates, students read the mass associated with the event, round to the nearest whole number, and put in a mass plot provided with their tally sheet. Once the data analysis time is complete, students take their resutls and combine them for the whole masterclass, adding all of the electrons and all of the muons from the W candidates to get a more definitiive e/μ and contributing all theor Z candidate rounded masses to an overall mass plot. A sample tally sheet is below. |
Sample data tally sheet