Short URL for this page: .
This document in PDF form: .
CMS WZH 2,4-Lepton Measurement
For "classic" CMS WZH 2-lepton measurement, go to CMS Masterclass 2019 Documentation.
Created by K. Cecire, T. McCauley, QuarkNet LHC fellows
The CMS WZH measurement is supported for International Masterclasses.
Languages supported: Chinese, Dutch, English, French, German, Hebrew, Hungarian, Italian, Japanese, Polish, Portuguese, Russian, Spanish, Turkish
Contents:
- Description
- Requirements for hardware and software
- Outline of the day
- Student procedure
- Presentation of results
- Sample questions
- Moderators
- Material for students and teachers
- Students use event display of (mostly) leptonic decays to determine
- final state: 1 electron plus missing ET, 1 muon plus missing ET, 2 electron, 2 muon, 4 electron, 4 muon, or 2 electron and 2 muon (note that lepton pairs should contain one negative matter lepton and one postive antimatter lepton)
- charges of leptons, especially for one lepton plus missing ET
- primary state: W+, W-, W± (indicating electric charge unknown), neutral particle, zoo
- charge if W, using curvature of electron or muon tracks,
- Students use particle counts to find e:µ and W+:W- ratios.
- Students create mass plots. They find the masses of neutral particle peaks in two mass histograms: 2-lepton and 4-lepton. Histograms are fed automatically upon entry of masses.
- Students use the iSpy-webgl event display and the CMS Instrument for Masterclass Analysis (CIMA). Instructional screencasts are available.
Dataset: There are 190 .ig data files in the iSpy event display. Each file contains 100 events. These files are made up varying mixtures from 10,000 1 and 2 lepton events and about 300 4-lepton events in varying mixtures, They are divided into data groups: N5, N10, N25, N50, and N100. The number after N refers to how many data files are in that data group. The ~300 4-lepton events are distributed equally in each group. Thus in group N5, each file has about 300/5 = 60 evetns with 4 leptons and 40 of everything else. In group N100, each file has about 3 events with 4 leptons and 97 events of other kinds. This is to accommodate masterclasses with different numbers of students.
Requirements
for hardware and software.
Online:
- Reliable, high-speed internet connection
- Up-to-date version of Firefox, Chrome, Edge, or Safari
Offline:
- Not recommended: use "classic" CMS WZH Dilepton Masterclass in this case or contact CMS masterclass coordination.
Outline of the day
This is not a final schedule but an outline for most U.S. institutes.
- Arrival/Registration (~30 min)
- Cloud chamber, e/m apparatus, or other "gateway experience" apparatus setup for students to inspect
- Start and Ice-breaker activity (~30 min)
- Students in small groups create 1-2 good questions about particle physics and/or LHC. Where practical, groups should be made of students from different schools.
- Mentor presentation
- Template (~60 min, including Q&A)
- Tour of facilities/labs/cool stuff (~45 min)
- Analysis preparation (1-2 teachers facilitate; ~60 min, including Q&A)
- Presentation (template)
- Data analysis slides
- Guided practice with discussion
- Lunch with a physicist (~60 min)
- Data Analysis (~90 min)
- Pre-conference (~30 min)
- Students and mentor discuss meaning of analysis results.
- Students and mentor discuss questions for other institutes.
- Revisit questions from ice-breaker, discuss which to ask in video conference.
- Designated IT expert preps video connection.
- Videoconference (~30 min)
- Greetings
- Presentation of results
- Discussion of results
- Q&A
- Summing up and evaluation (~15 min)
Student tasks:
- Each pair of students analyzes a set of 100 events
- For each event, distinguish between electron and muon decay and between
- W+ or W- candidate (recorded as "W±" if charge cannot be determined),
- Neutral Particle (Z, H or other "neutral particle" candidate),
- and zoo event (unusual and cannot be characterized).
- Record into CIMA.
- Be prepared to discuss in Masterclass Institute and in videoconference; prepare good questions.
Student procedure
It is important to carefully note the following:
- Mentors and tutors need to be familiar with CIMA in order to guide the students successfully.
- The description below is for the current version of the iSpy event display and advanced CIMA used for the CMS WZH 2,4-lepton masterclass. (Note that these are still development versions but will be moved soon to production servers.) This is the primary version used in International Masterclasses.
- The "classic" WZH diplepton masterclass uses the "classic" iSpy-webgl. and "classic" CIMA. For a description of how to use these, see the CMS WZH Masterclass 2019 Documentation.
- The legacy iSpy-online is still recommended for the J/Psi-path masterclass. This is described on the CMS masterclass webstie J/Psi-path page.
Mentors should guide students to follow these procedures for the use of iSpy and CIMA:
Screencast: https://www.screencast.com/t/lFq86uolB.
- Pairs of students are assigned sets of 100 events to analyze in iSpy-online or iSpy-dvd.
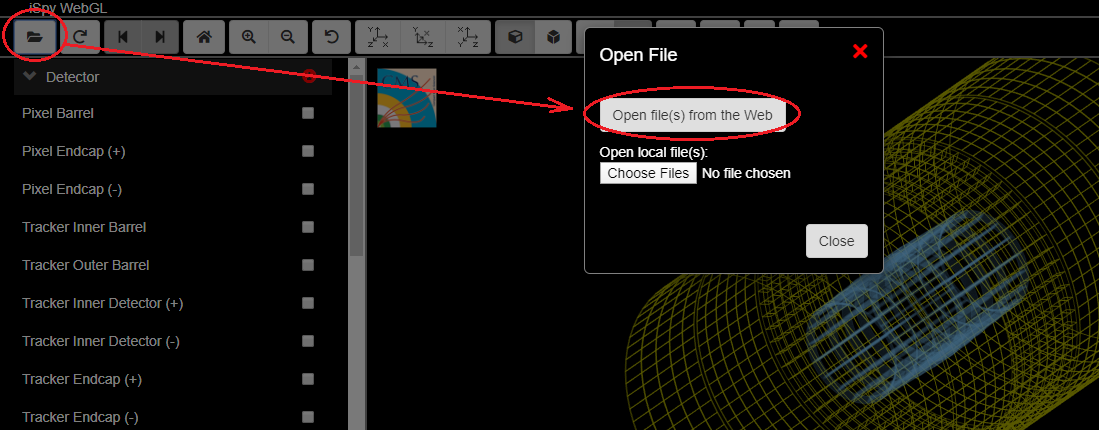
- Event sets are found in the iSpy by choosing the folder icon (top left).
- A first window appears. If the data is to be taken from the internet, choose "Open file(s) from web" in this window. If the data is offline, choose the button under "Open local file(s)" and navigate to the file. Either way, a second window will open.
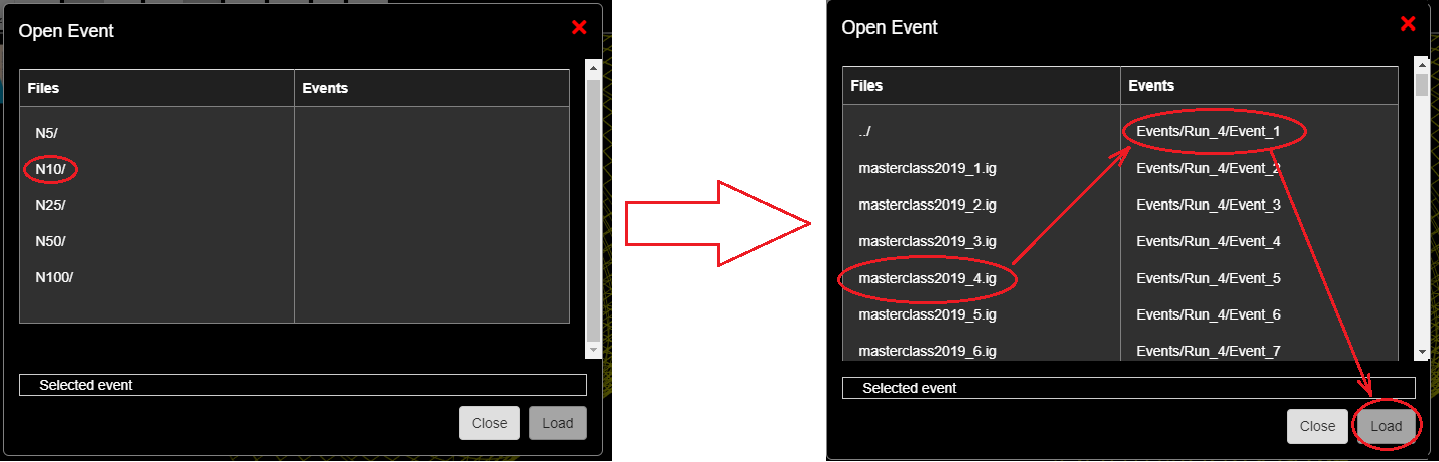
- In the second window, students first choose their data group - N5, N10, N25, N50, or N100 according to their assignment. After choosing a group, they will see a set of data files labeled masterclassyear_n.ig, where year is the year of creation of the file (currently 2019) and n is the number of the data file. For N5, n = 1, 2, ..., 5; for N10, n = 1, 2, ..., 10, etc. The entire set of 100 events will then load into the browser. This may take some time but going from event to event is rapid after that.
- After the set of 100 events is loaded, a list of events in that set will appear on the left side of the window. The student chooses the first of these events and then the "Load" button. This will open the first event.
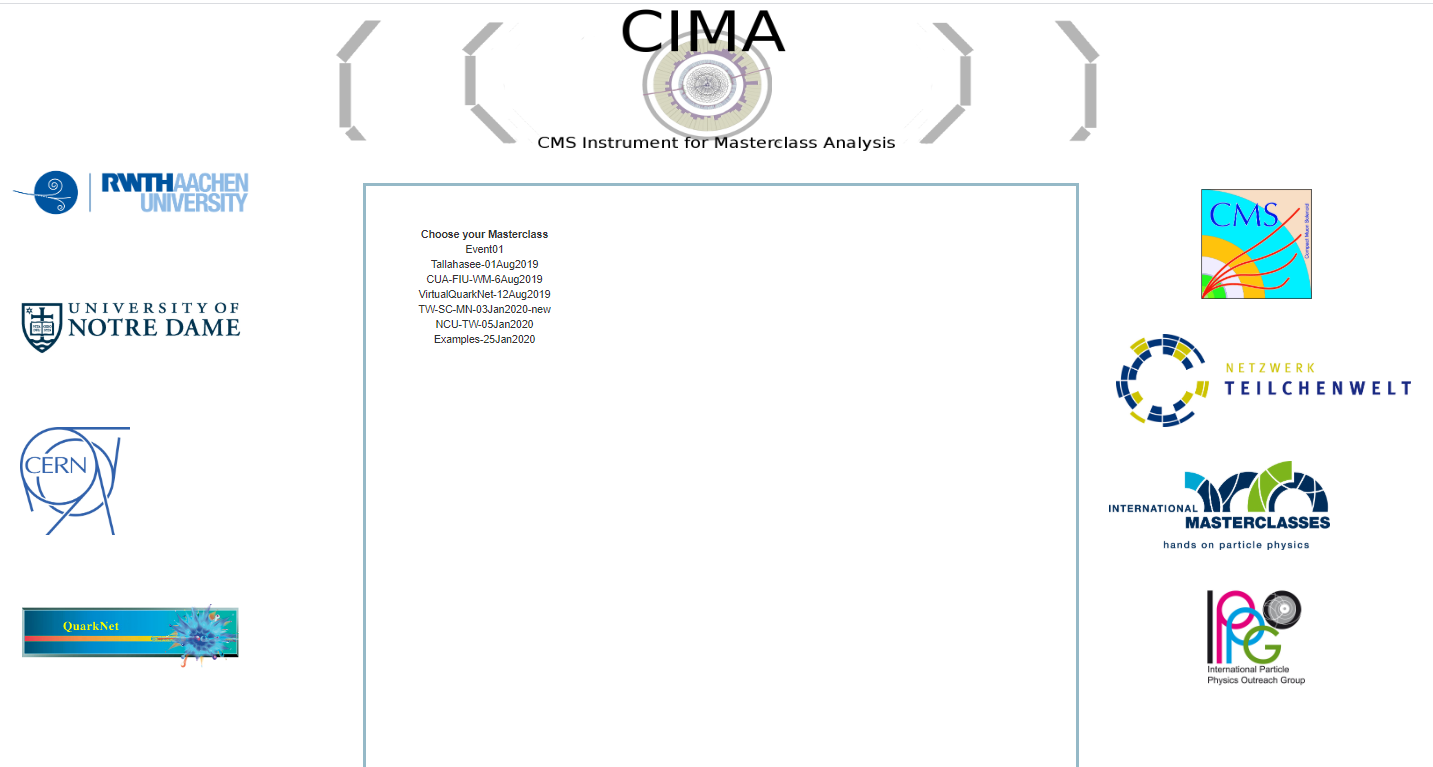
- Students also open CIMA and then find their masterclass by date ("Choose your Masterclass") and then institute ("Choose your location"). They then choose the number of their event set ("Choose your file"): this is the same number as the event set in iSpy but rendered a N.n, That is, group N25, file 6 is rednered as 25.6.
- Notes on CIMA for students:
- All institutes are strongly encouraged to use advanced CIMA rather than a local spreadsheet.
- CIMA will have your date and your institute from to choose.
- Advanced CIMA automatically populates the mass histograms. This is no long something students do manually as in the "classic" version..
- CIMA is also linked at the CMS Library page (scroll down to Data Analysis).
Find the correct data files in iSpy and CIMA:
After iSpy is open, go the the file folder and, when the pop-up box appears, choose "Open files from web",
Then choose the assigned data group (N5, N10, ...). A list of data files will appear. Choose the assigned file. Then choose the first event and the Load button.
The first event will appear.
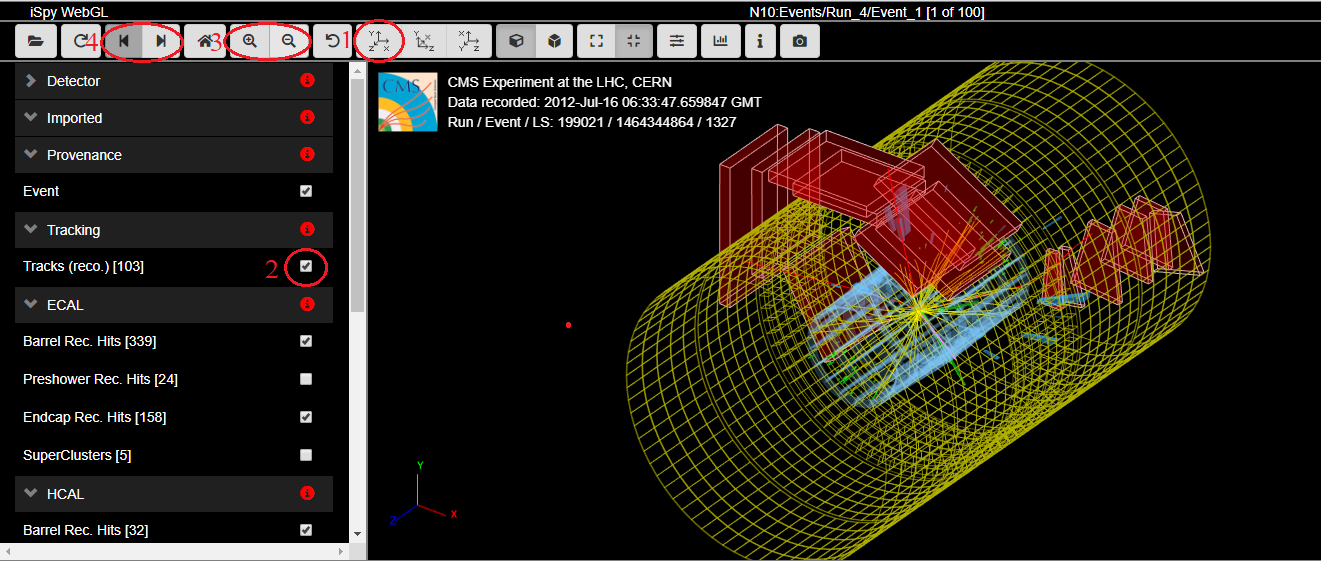
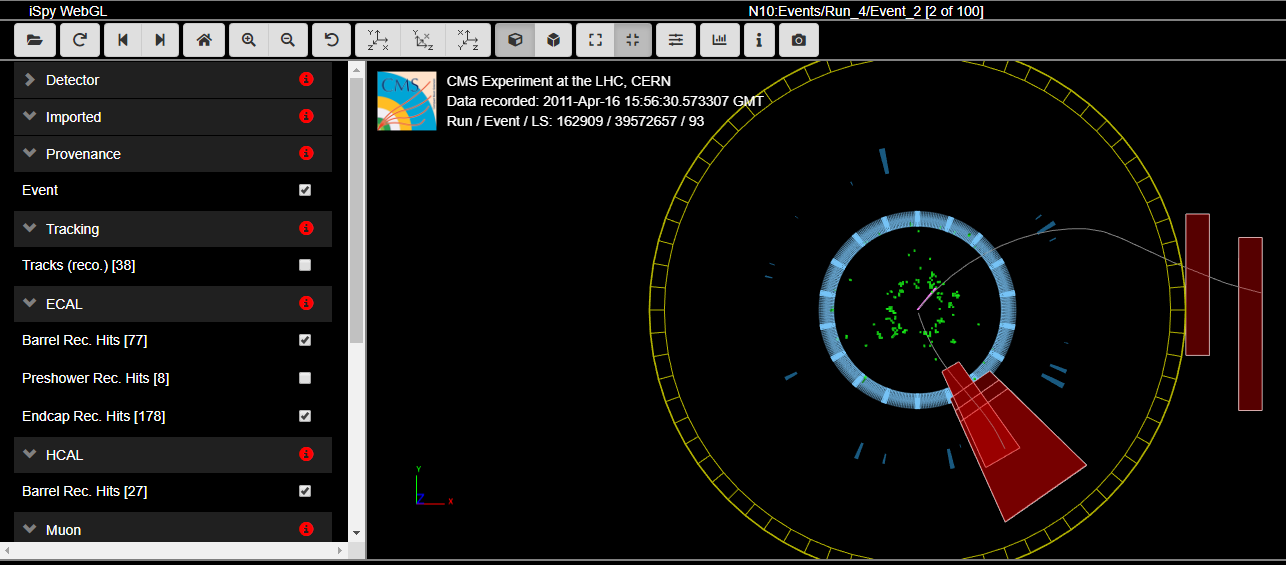
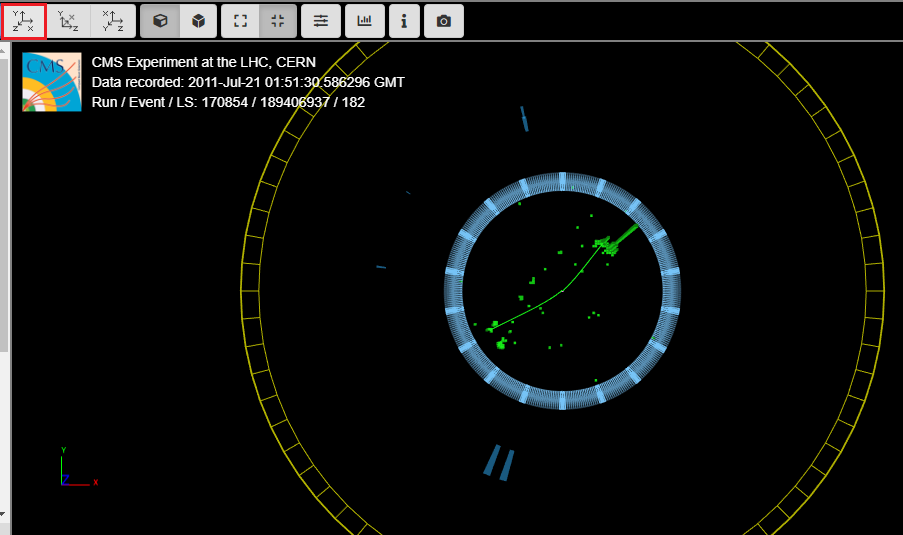
Set it to the x-y (end) view by choosing the x-y button (1). Remove unwanted low energy tracks by unchecking Tracks (reco.) (2). You can use the magnifying glass buttons (3) to zoom in or out and the right (left) arrow button (4) to go to the next (previous) event. This is the result of doing all 4 of these:
This display shows the final state of the event. The red tracks are muon tracks as identified by the analysis software. Note the red boxes: they are muon chambers intersected by the muons. One can see by the opposite curvatures of the tracks in the x-y plane (transverse to the beamline and to the magnetic field) that they are of opposite electrical charges. In these renderings, a clockwise curvature indicates positive change and an anti-clockwise curvature indicates negative charge.
The two muons may have come from a primary state particle. To find its mass, we can move our mouse until one track turns gray, click, move again until the second track turns gray, and click again. This is what happens:
We then press m on the keyboard and the mass of the primary state particle appears:
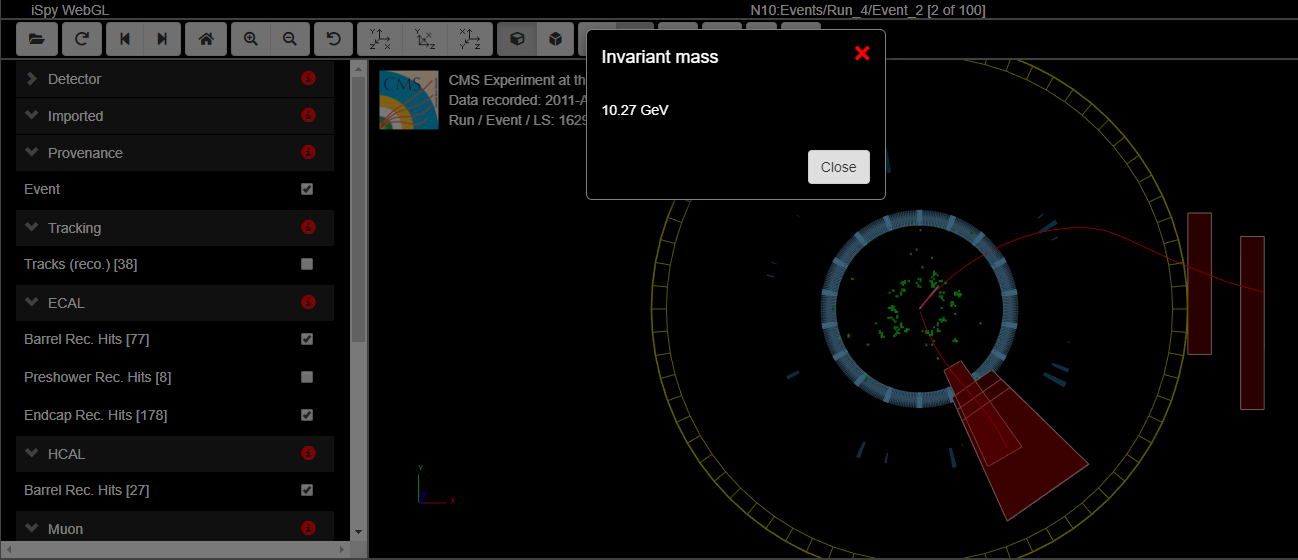
Note that the muon tracks are reset to red once the mass appears.
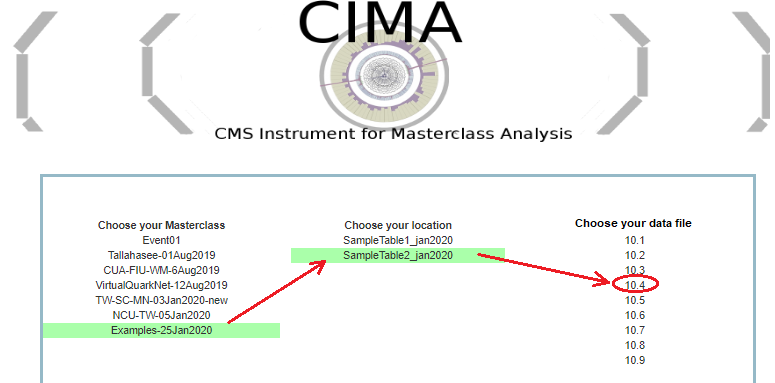
What we do with this data is what goes in CIMA. Here it is:
We now choose our masterclass, location, and data file (10.4, same as we saw in iSpy above).
When we open data file 10.4, we see that event 10.4-1 is already done. We must add results for 10.4-2, seen in the iSpy images above. From the left, we see it is loaded as event 2, it is a dimuon event so we choose μμ for Final State, we pick Neutral Particle for Primary State, and we enter the 10.27 we have for the mass is GeV:
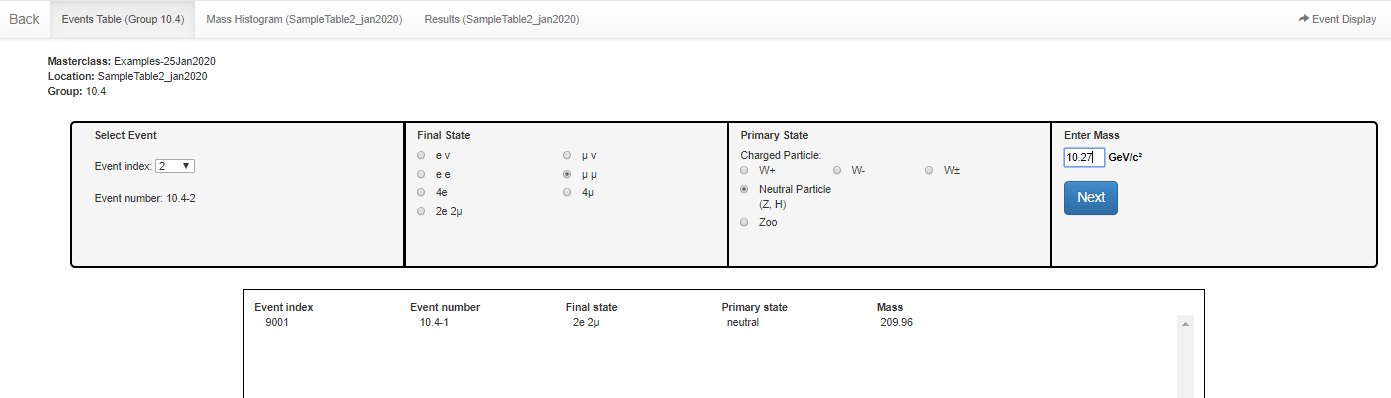
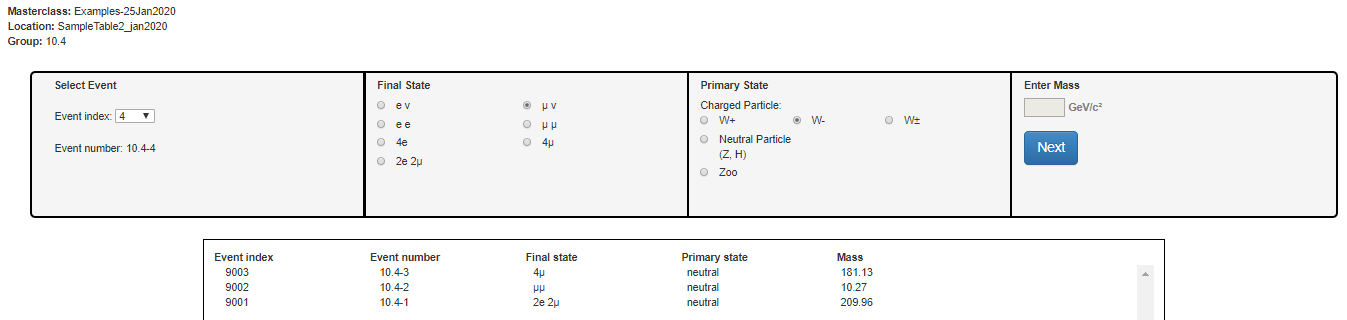
When we choose the Next button, the results are recorded for 10.4-2 just as they were for 10-4.1. We return to iSpy and advance to the next event and the next, recording results in CIMA as we go. At 10.4-4, for example, we have a single-muon plus missing ET event:
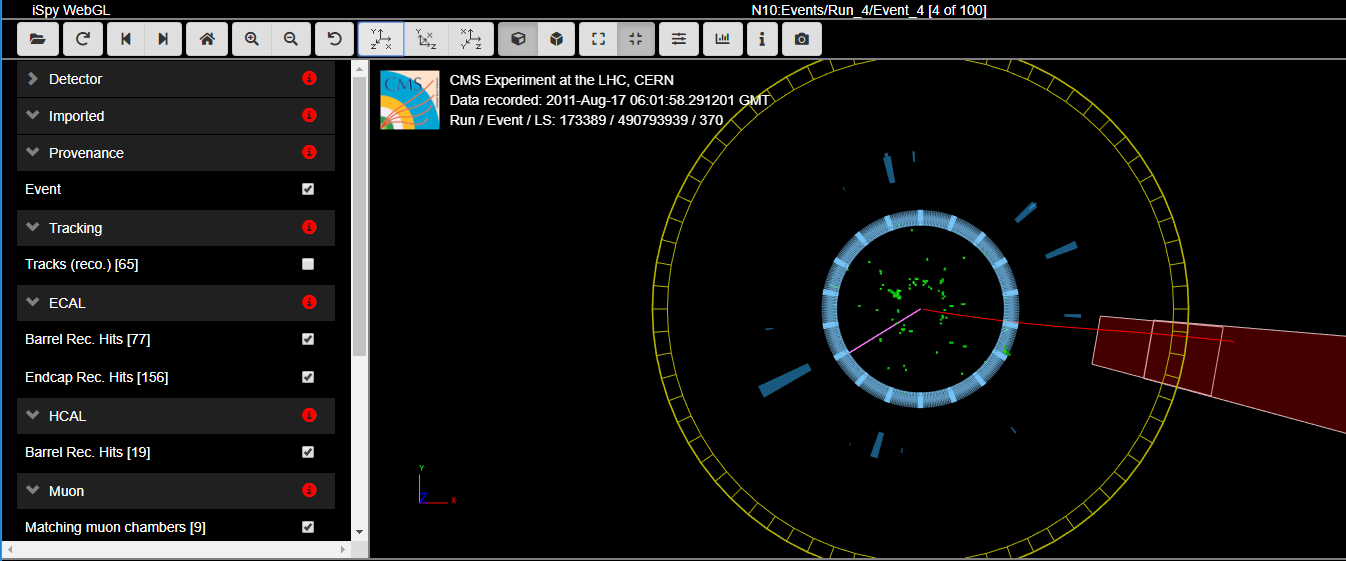
The purple or pink line is indicative of missing ET, presumably a neutrino. Note that the muon is negative because the track curves anti-clockwise in the magnetic field. Thus we this this is a W- candidate event, in whihc the W- decayed into a muon and a muon anti-neutrino. We can record this in CIMA as μν for the Final State and W- for the Initial State. We do not try to find or record a mass for any W candidate. CMS can only find the transverse mass of a W candidate and these cannot mix into our mass hisotgrams in any meaningful way. Here is how it is recorded:
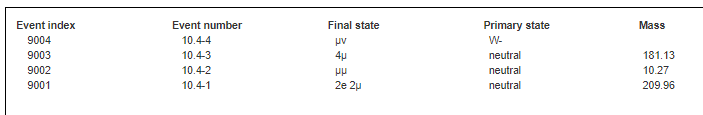
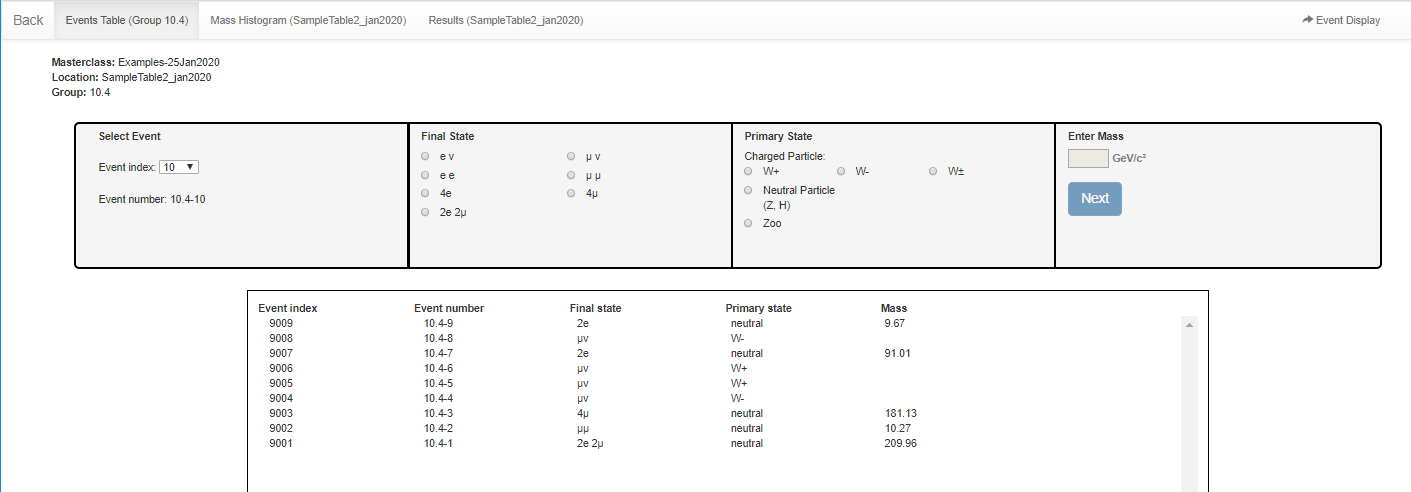
Here is the recorded result after we choose Next and have our first four events:
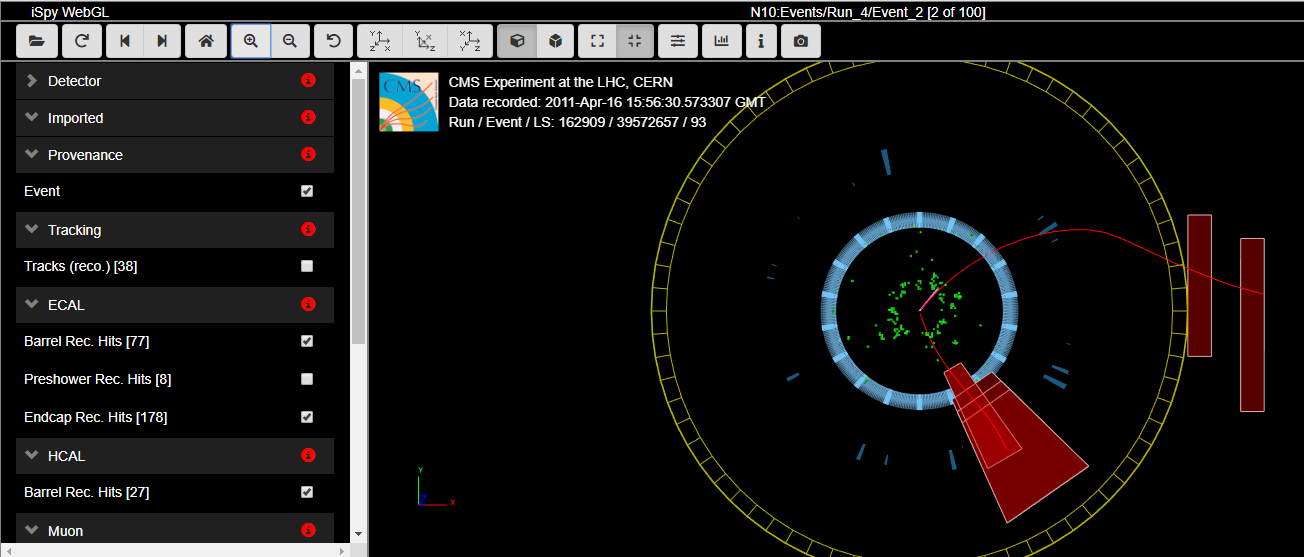
Continuing on, when we get to Event 10.4-9, we find two electrons (green tracks) but the seem rather short and without much of the characteristic energy deposit which follows the track:
Let's look at the y-z view:
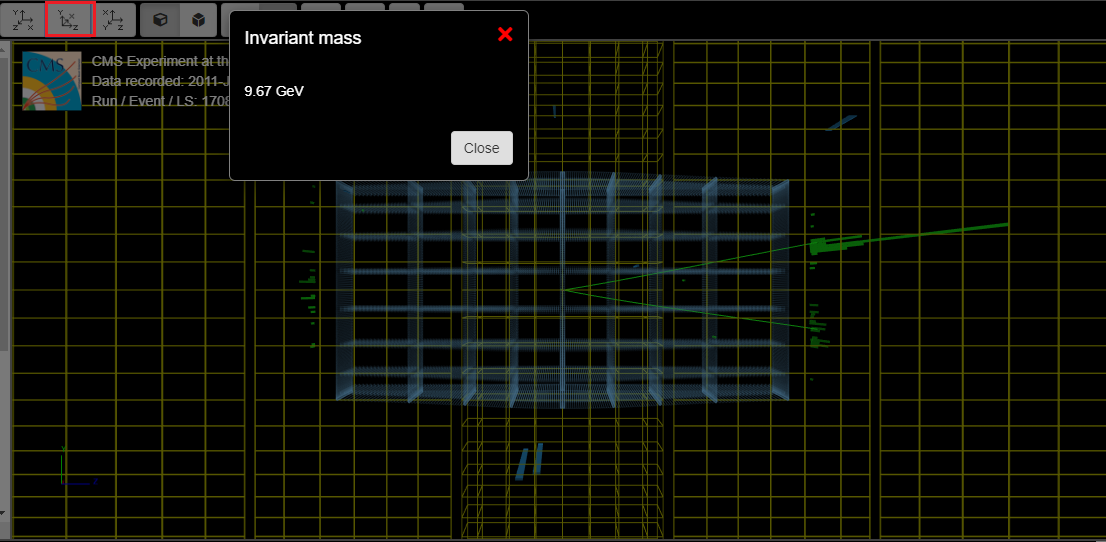
We can see the energy deposits (they look like 3-D histograms) and the reader will notice that we have already found the mass of the primary state particle. We enter it into CIMA:
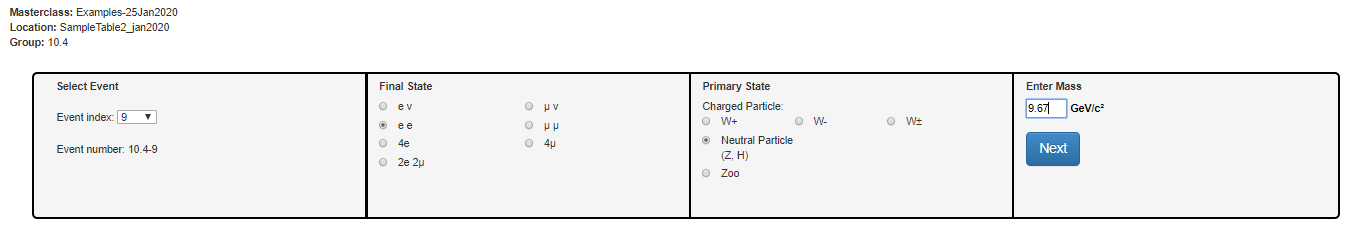
Then we choose Next:
There is enough here to look at the other tabs. Here are the histograms we have so far with this very small data sample (2-lepton above, 4-lepton below):
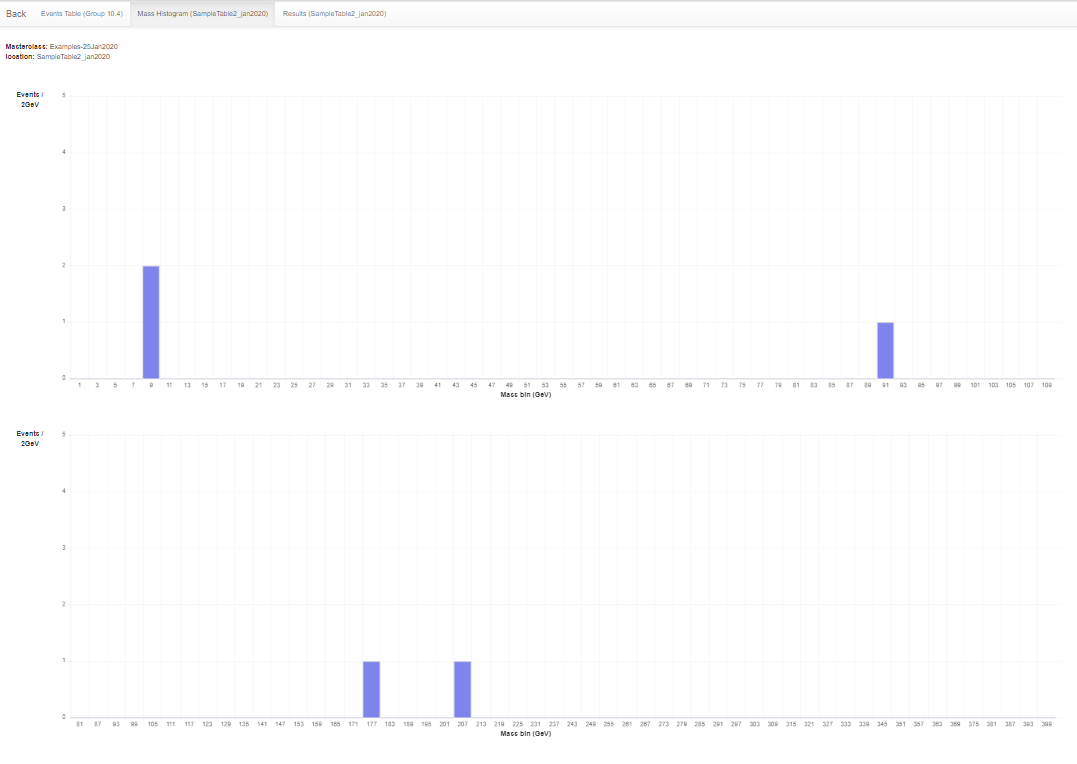
This is not much to look at yet but a whole class of students, with every 2 taking on a 100-event data file, can populate it a bit more.
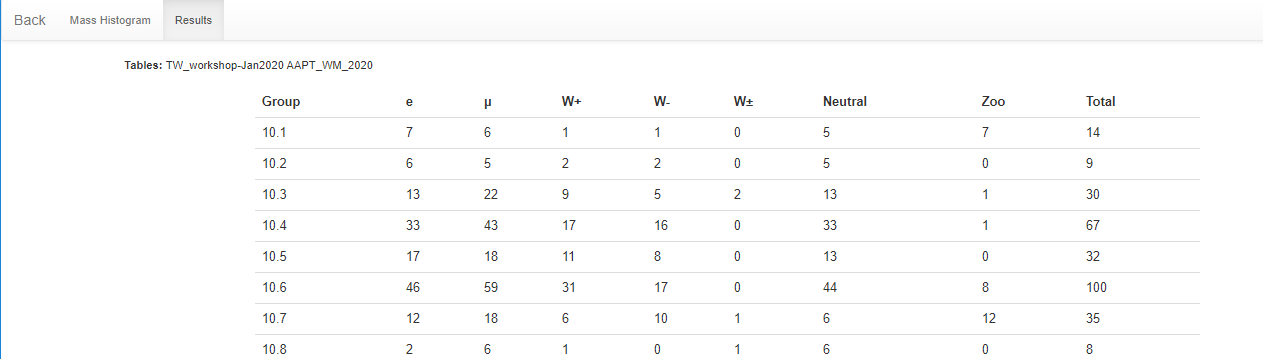
Here is our Results tab:
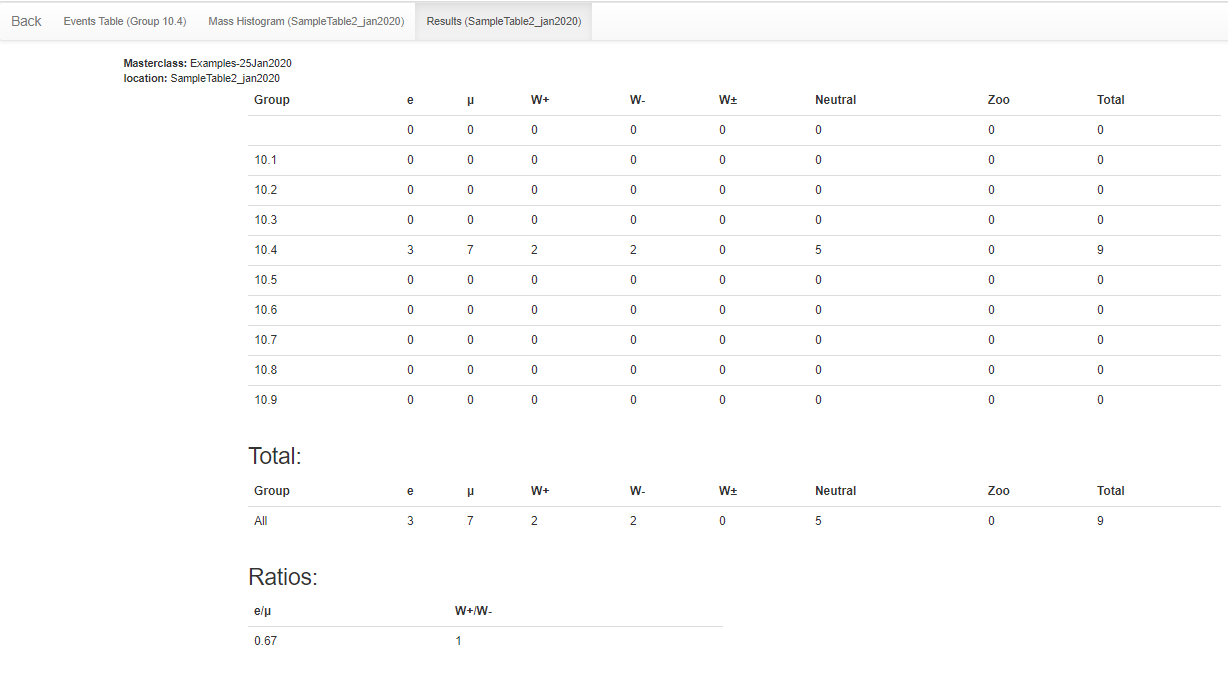
Note the key ratios at the bottom. Our expectation is e/μ = 1 and W+/W- = 1.4 but results will vary quite a lot.
In summary, students use event display of (mostly) leptonic decays to determine
- Final state lepton ID (electron, muon). This is to characterize the event, not individual particles.
- If the event has one muon track (long, red) and missing ET (purple or pink line) is is a μν event.
- If the event has one electron track (short, green) and missing ET (purple or pink line) is is an eν event.
- If it has two muon tracks (actually likely a muon-antimuon pair) it is a μμ event
- If the event has two electron tracks (actually likely an electron-positron pair) is is an ee event.
- If it has 4 short green electron tracks it is a 4e event.
- If it has 4 long red tracks is is a 4μ event.
- If it has 2 short green and 2 long red tracks it is a 2e2μ event.
- Likely particle ID (final state)
- W candidates are cases 1 and 2 above. The charge of the W boson can usually be determined from the curvature of the visible lepton track in the x-y view: positive for clockwise, negative for anti-clockwise. If the curvature cannot be detected then the final state is W±, meaning we cannot determine the charge.
- Neutral Particles are cases 3-7.
- Cases 3 and 4 are 2-lepton events and their masses should show up in the upper mass histogram.
- Cases 5-7 are in 4-lepton events and their masses should show up in the lower mass histogram.
- Some events will have multiple lepton tracks plus missing Et. The student can choose a track with the cursor (tunring it gray) and a track information will appear in the table below the image in iSpy. The most important of these is transverse momentum, pt. This can be used to distinguish which tracks are important and which are low-energy background.
- Zoo events are "none of the above" but there can be interesting events among these.
Presentation of results
The mass plots and summary of results are automatically built in the institute (location) Mass Histogram and Results pages. The upper (2-lepton) mass plot will show not only a Z peak but also peaks due to other particles. The results will show the numbers of electron, muon, W+, W-, W± (unknown charge), Neutral Particle candidates, and zoo events plus the key ratios e:μ and W+:W-. The mentor or tutor should project the mass plot and the count/ratio results and discuss their signficance with students. The mentor or tutor should also help the students to generate questions for the videoconference or other later discussion.
For Fermilab-based videoconferences, the mentor should show the students the Mass Histograms and Results for another institute. Each institute is assigned another one to which they may ask one or two questions. In our example, Buffalo may ask questions of Mexico City and Mexico City may ask questions of Quito, etc.
Sample questions
In discussion, the moderator might ask students
- How many peaks are there in the 2-lepton mass plot?
- Where is the Z peak? What is the mass of the Z boson?
- What do the other peaks mean?
- Is there a Z-peak in the 4-lepton plot? If so, why?
- What else can we see in the 4-lepton plot. Is there evidence of the Higgs boson? What else?
- What is the ratio of electrons to muons? Is it close to what we should expect?
- What is the W+:W- ratio? What should it be?
In the videoconference, students might ask questions like
- Why are the widths or heights or numbers of peaks different from one Institute to the next?
- Why do different Institutes get different ratios? How did they identify electrons or muons or W candidates or Z candidates or zoo events? How did they measure charge for W candidates?
- Now that the Tevatron is shut down, what do you do at Fermilab?
- Is it boring at CERN when the LHC is not running?
- Why did you become a physicist?
...and better questions which only students can create.
Moderators
Fermilab-based moderators should refer to the FNAL Masterclass Moderators page.
All moderators should note the following:
As long as all groups use advanced CIMA, moderators do not need to look for uploads from any of the masterclass institutes or make histograms on their own. There is one "Table" for each masterclass institute (location) participating in a single videconference. Each institute has a Mass Histrogram and a Results page.
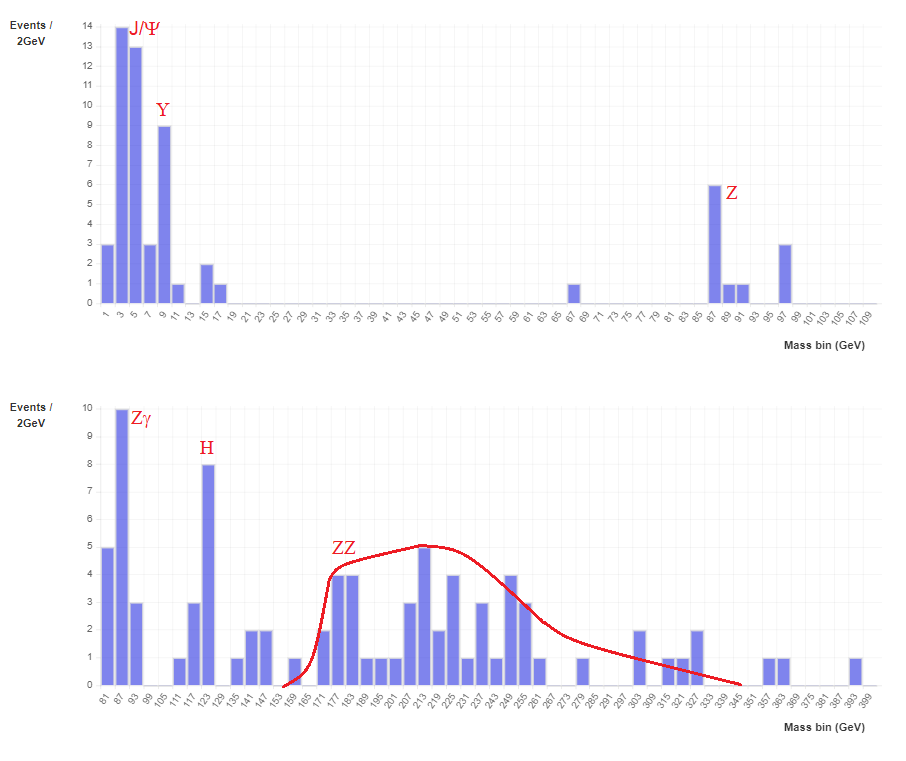
- Mass Histograms - students use "Events Tables" to record W or Neutral Particle (J/Ψ, Υ, Z, Zγ, H, ZZ candidates), e or µ events, and "zoo" events.
- The Neutral Particle candidates may show up in the 2-lepton and 4-lpeton mass plots. The plots populate autmatically as students work.
- Results - numbers of different types of particles are automatically transferred here; e:µ and W+:W- are calculated for the whole institute.
The moderators will access the Admin page of CIMA to view these and share them on Vidyo. They will also view and share the combined Mass Histogram and combined Results for all institutes participating in their videoconference.
To get to the appropriate places, moderators only should go to the CIMA Admin page.
Then:
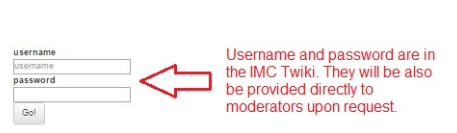
- Log in. The user name and password will be sent separately.
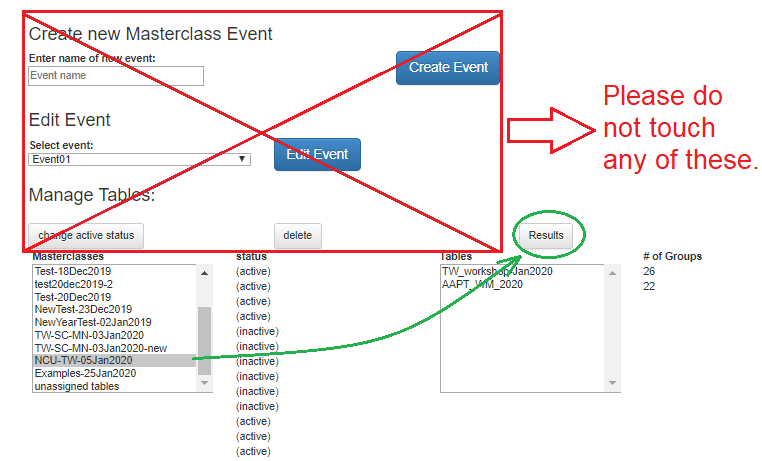
- Please do not touch anything above Manage Tables or the "change active status" or "delete" buttons..
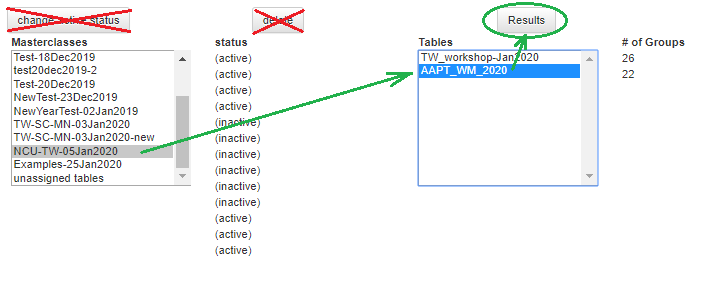
- Go to the part of the page under Masterclasses beneath the Manage Tables heading.
- Choose the appropriate masterclass. Below we choose NCU-TW-05Jan2020.
- We then choose the Results button.
You are now on the Results tab for combined results for all institutes in the videoconference.
In this case, there are only two: TW_workshop_Jan2020 and AAPT_WM_2020. You can then choose the Mass Histogram tab to view the mass plots.
To choose results for a particular institute (and you should do this for each one), use the browswer bakc arrow to back out to the main CIMA admin page. Then choose the overall masterclass and the individual masterclass:
Moderators should discuss the results from each institute and the overall results with the students, making sure to stay within time constraints. If an institute does not use the online spreadsheet, the mentor for that institute should show their mass plot and results using Vidyo desktop sharing. (This may occur due to bandwidth issues or if if a group uses the "classic" WZH 2-lepton masterclass.)
The two mass plots for the combined results are below with annotations. Even with a relatively small number of events, we can see a basic outline with key peaks, though as it turns out the Higgs peak is probably exaggerated in this sample.
Material
for students and teachers:
- Classroom prep activities
- Rolling with Rutherford at https://quarknet.org/data-portfolio/activity/rolling-rutherford
- Particle cards at https://quarknet.org/data-portfolio/activity/shuffling-particle-deck
- Quark workbench at https://quarknet.org/data-portfolio/activity/quark-workbench
- Calculate the mass of the top quark from Tevatron data at https://quarknet.org/data-portfolio/activity/calculate-top-quark-mass
- Calculate the mass of the Z boson from LHC data at https://quarknet.org/data-portfolio/activity/calculate-z-mass
- Aid in masterclass
- Analysis presentation at https://quarknet.org/sites/default/files/cms_analysis_18nov2019_0.pdf
- CMS Masterclass "Cheat Sheet" at https://quarknet.org/sites/default/files/cmscheat_wzh16_v0.pdf
- Student webcast on using iSpy-webgl: View on YouTube.
- iSpy/CIMA webcast: View on screencast.com.