
MicroBooNE Masterclass 2020 Documentation
This document in PDF form: http://tiny.cc/ub-doc-imc20.
External Links:
- MicroBooNE Masterclass guide
- Masterclass Library
- MicroBooNE Masterclass website
- International Masterclasses
MicroBooNE Argon Purity and Electron Drift Velocity Measurements
Created by K. Cecire, T. Eggleston, S. Gollapinni, E. Johnson, S. Pasero, N. Tagg, S. Wood, QuarkNet Neutrino fellows
The MicroBooNE argon purity and drift velocity measurements are supported for piloting during International Masterclasses 2020.
Languages supported: English
Contents:
- Description
- Requirements for hardware and software
- Outline of the day
- Student procedure
- Presentation of results
- Sample questions
- Moderators
- Material for students and teachers
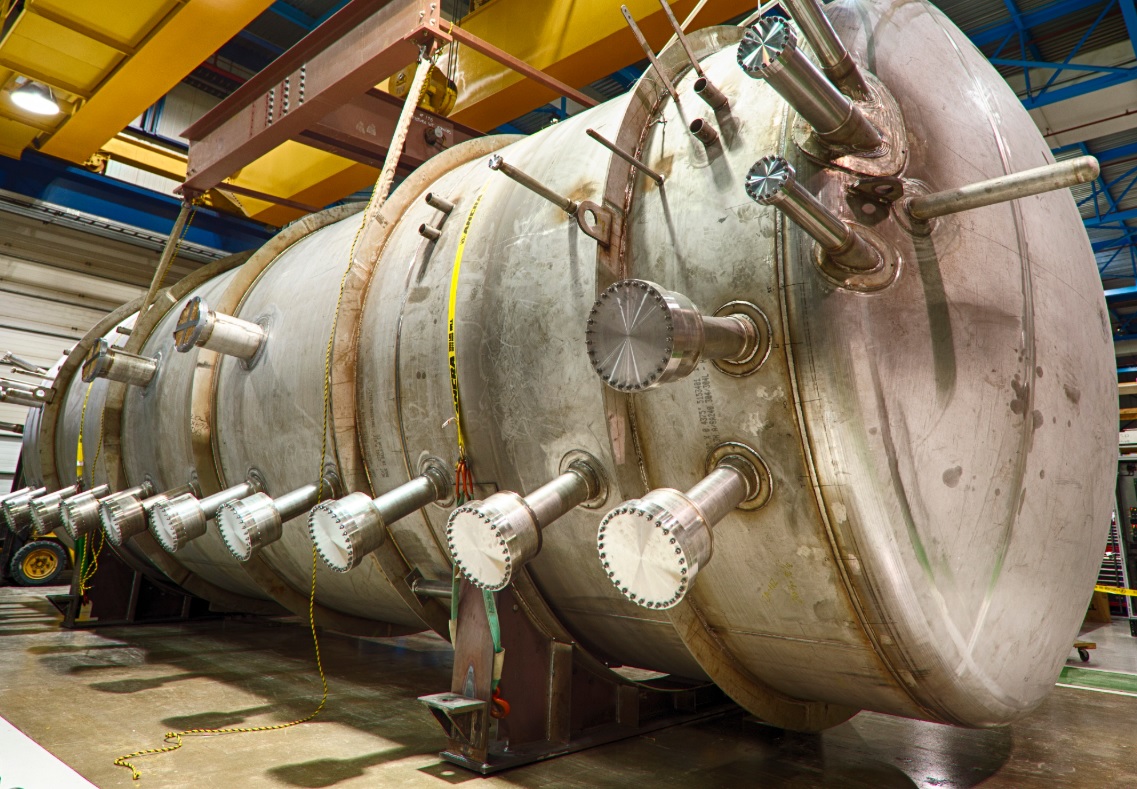
(Credit: Fermilab)
Description
In the MicroBooNE masterclass, students use an event display of cosmic ray particles interacting in the MicroBooNE detector to measure
- electron drift-lifetime in order to estimate argon purity (part 1).
- average drift velocity of electrons (part 2).
Part 1: Electron Drift Velocity - Argon Purity Measurement
Motivation: Why does MicroBooNE care about purity of liquid argon? And why is it important to measure?
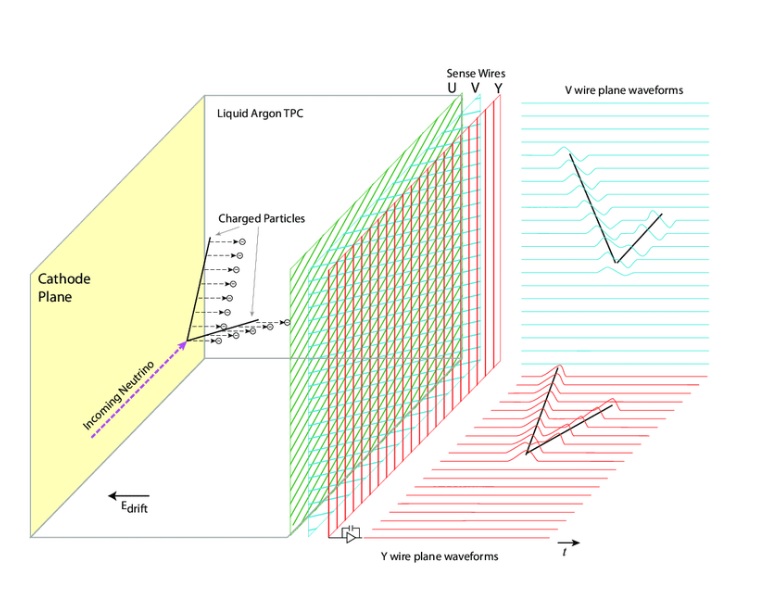
MicroBooNE is a Liquid Argon Time projection Chamber (LArTPC) experiment. A LArTPC consists of a cathode and an anode enclosed in a volume of liquid argon and the cathode is provided with very high voltage (-73,000 V in MicroBooNE). When neutrinos or cosmic ray particles enter the detector and interact with the argon nuclei, they produce charged particles. These charged particles ionize argon (i.e., strip off electrons off of the nucleus) producing “ionization electrons” (our signal) and Ar+ ions. An electric field drifts the positively charged Ar+ ions to the cathode and negatively charged ionization electrons towards the anode where we collect our singal. This forms the basic principle of a LArTPC.
One of the important operational principles of a LArTPC is to keep the liquid argon extremely pure because otherwise electronegative impurities such as oxygen and water (they have high electron affinity) in liquid argon can capture the drifting ionization electrons thereby resulting in the loss of the recorded electron signals on the anode. The number of ionization electrons collected on the anode gives the charge information and thus the energy deposited by a given particle. So, if ionization electrons are lost in the drifting process due to impurities, then the particle trajectories and their energies cannot be reconstructed properly which will ultimately impact any further analysis one can do on that data.
MicroBooNE requires that the total contamination (referred to as O2 equivalent contamination) to be less than 60 parts per trillion (ppt)) which corresponds to about losing 36% of the ionization signals. MicroBooNE uses an extensive liquid argon purification and recirculation system in order to achieve this. Liquid argon is continuously recirculated to maintain purity levels and to remove impurities that may accumulate over time. If the liquid argon purity is not at the minimum desired levels, the data collected can become useless for physics. Hence purity forms a critical quantity for MicroBooNE to continuously measure and monitor to make sure it is at desired levels.
Using cosmic ray particles interacting in the MicroBooNE detector, one can measure a quantity called “electron drift-lifetime (τ)” and use that to extract the impurity concentration as tau is inversely proportional to it. The larger the tau value, the smaller the contamination and signal loss, so experiments aim for achieving very high electron drift-lifetime. For example, tau=10 ms corresponds to a signal loss of 20% and impurity contamination of 30 ppt. 60 ppt contamination and 36% signal loss would correspond to tau=5 ms. In 100% pure liquid argon, electrons will drift forever resulting in infinite lifetime.
Dataset: There are XXXXX events from MicroBooNE, each containing several tracks. Some groups of events are from data taken with high argon purity, while the remaining groups are from data taken with lower argon purity in the MicroBooNE detector. Based on electron drift-lifetime measurements, students will determine if their data came from high or low argon purity.
Requirements
for hardware and software.
- Reliable, high-speed internet connection
- Up-to-date version of Firefox, Chrome, or Safari
Outline of the day
This is not a final schedule but an outline for most U.S. institutes.
- Arrival/Registration (~30 min)
- Cloud chamber, e/m apparatus, or other "gateway experience" apparatus setup for students to inspect
- Start and Ice-breaker activity (~30 min)
- Students in small groups create 1-2 good questions about particle physics and/or LHC. Where practical, groups should be made of students from different schools.
- Mentor presentation
- Template (~60 min, including Q&A)
- Tour of facilities/labs/cool stuff (~45 min)
- Analysis preparation (1-2 teachers facilitate; ~60 min, including Q&A)
- Presentation (template)
- MicroBooNE data analysis slides
- Guided practice with discussion
- Lunch with a physicist (~60 min)
- Data Analysis (~90 min)
- Cheat sheet
- Pre-conference (~30 min)
- Students and mentor discuss meaning of analysis results.
- Students and mentor discuss questions for other institutes.
- Revisit questions from ice-breaker, discuss which to ask in video conference.
- Designated IT expert preps video connection.
- Videoconference (~30 min)
- Greetings
- Presentation of results
- Discussion of results
- Q&A
- Summing up and evaluation (~15 min)
Student tasks:
Argon Purity Measurment
- Each pair of students analyzes a set of 100 events
- For each event, distinguish between electron and muon decay and between
- W+ or W- candidate (recorded as "W" if charge cannot be determined),
- NP (Z or other "neutral particle" candidate),
- Higgs candidate,
- and zoo event (unusual and cannot be characterized).
- Record into CIMA.
- Be prepared to discuss in Masterclass Institute and in videoconference; prepare good questions.
Student procedure
Mentors should guide students to follow these procedures for the use of Argo and Google Sheets:
Argon Purity Measurment (Add screencast)
Spreadsheet
- Google Sheets - choose appropriate spreadsheet for your institute.
Data
- Data Set A (note to remove: this is low purity samples)
- Data Set B (note to remove: this is high purity samples)
Selection and Data Collection
- Choose tracks that have a drift distance of 50 cm or higher. In the Argo display, the vertical axis is the drift direction i.e., the direction in which electrons drift and the horizontal axis is the beam direction. So, check that the length of the track in the vertical direction is 50 cm or greater.
- Ensure that there is no background activity (e.g. fuzz or change in color/energy deposition) near the start or end point of the track. This is important to minimize charge fluctuations. If you do see charge variations or fuzz near the tracks, try to move a bit inwards on the track (but not too much) to pick a clean part of the track.
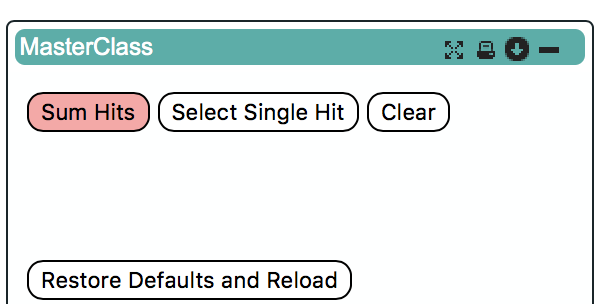
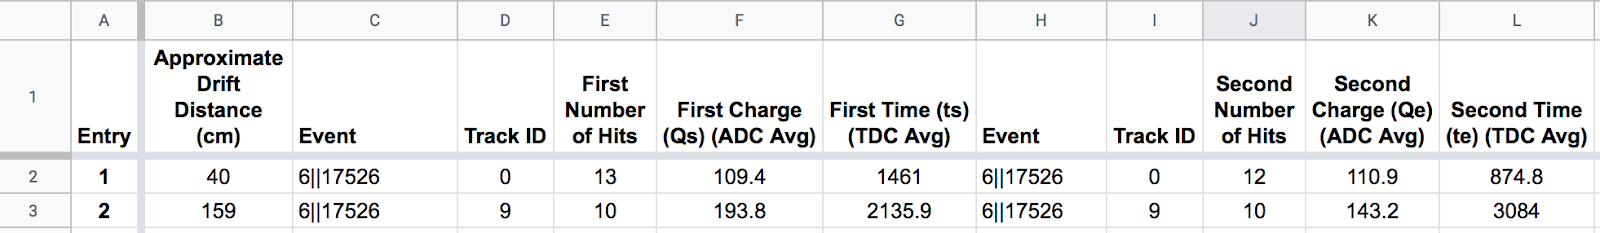
- Once you have selected your track, under the "MasterClass" window, select the "Sum Hits" button.
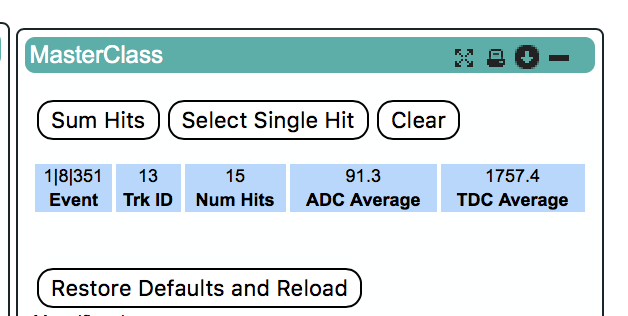
- Go to one end of the track and select about 10-15 hits in a clean region of the track (adjust the magnifier size and/or move along the track to select the desired number of hits). Once at the desired number of hits, a mouse click will output the selected data into the "MasterClass" window and copy this information to the clipboard.
- Paste the copied data into the spreadsheet under appropriate columns.
- Now, repeat the same for the other end of the track and paste the copied data into the spreadsheet in the next set of columns labeled "Second."
- Continue this process for all appropriate tracks in the event before moving on to the next event. Each group will have 20 events, with each event containing several tracks.

- asdlksajdf
-
Choose tracks that have a drift distance of 50 cm or higher. In the ARGO display, the vertical axis is the drift direction i.e., the direction in which electrons drift and the horizontal axis is the beam direction. So, check that the length of the track in the vertical direction is 50 cm or higher.
-
Ensure that there is no background activity (e.g. fuzz or change in color of energy deposition) near the start or end point of the track. This is important to minimize charge fluctuations. If you do see charge variations or fuzz near the tracks, try to move a bit inwards of the track (but not too much) to pick a clean part of the track.
Find the correct data files in iSpy and CIMA:
Open iSpy-webgl event display. To find the correct dataset, choose the file folder icon at the top left the choose
events from the web or locally; when the "Open Event" box appears, find your dataset, choose the first event, and
then choose the "Load" button.
Open CIMA and find your dataset. First choose the date and then the location list appears. Choose your institute
and then your set of events.
Students use event display of (mostly) leptonic decays to determine
- Final state lepton ID (electron, muon). This is to characterize the event, not individual particles.
- If the event has one muon track (long, red) or two muon tracks (actually likely a muon-antimuon pair) it is a single muon event.
- If the event has one electron track (short, green) or two electron tracks (actually likely an electron-positron pair) is is a single electron event.
- Likely particle ID (W, NP, zoo, Higgs)
- W candidate appears as a single electron track or muon track and a missing Et vector (dashed purplish/pinkish track, transverse to beamline)
- NP in CIMA refers to Z or other neutral particle candidate which decays into 2 final state muons or 2 final state electrons. It may or may not have some missing Et in the event. If a student finds an NP candidate in iSpy-webgl, they must shift-click on each of the 2 lepton tracks to get a calculated invariant mass of the parent neutral particle.
- Some events will have multiple lepton tracks plus missing Et. The student can choose a track with the cursor and a window will appear with track information. The most important of these is transverse momentum, pt. This can be used to distinguish which tracks are important and which are low-energy background.
- Suspected Higgs (H); these are rare but noteworthy. Events show as
- H→ZZ: 2 electrons and 2 muons, or 4 electrons, or 4 muons.
- H→γγ: no electron tracks but 2 large energy deposits (seen as towers) in ECAL.
- Zoo events are "none of the above" but there can be interesting events among these.
- Charge if W, using curvature of electron or muon tracks. It helps to select the X-Y view and "orthographic mode" (the "flat cube" button), zoom in and to use a paper straight edge.
- Mass of Higgs candidate (taken from CIMA)
- Mass of the NP candidate from iSpy-webgl and transferred into CIMA.
After a pair of students has found their "group" or dataset in CIMA, they will be sent to their Events Table. They will see checkboxes at the top to characterize each event. They should look at the corresponding event in iSpy-webgl (they can check the event numbers to be sure they do correspond) and determine which sort of event it is, following a few rules:
- Choose whether it is an electron or muon event under "final state".
- If the event is a Higgs or zoo candidate (under "special"), no final state is chosen.
- Choose the most likely parent particle under "primary".
- If it is a Higgs candidate (diphoton or 4-lepton), a mass will appear.
- If it is NP (Z or other neutral particle), type the mass in GeV into the NP mass box.
- If it is a W or zoo, no mass will appear as we do not include these in the mass plot. If a W and a charge can be determined, choose either W+ or W-. Only choose W without a sign if the lepton track is so straight that a probable charge cannot be determined..
- Choose the Submit button. This puts the data below in a line corresponding to the Event Index number.
- In the case of an error, double-clicking the data line will erase it; you can then try it again.
Sample data entered into CIMA. These entries were made randomly and do not show any preferred results.
Note the mass typed into the NP Mass box. This number would have been generated in iSpy-webgl.
- When a mass is shown in the line for an event, the students should record it in the Mass Histogram. The student should:
- Choose "Mass Histogram" at the top.
- Zoom to get a good size for the massplot, if needed, using ctrl-minus (PC) or cmd-minus (Mac).
- The numbers on the horizontal axis are the values of the middle of the bins of width 2 GeV. Select the bin by clicking. This will iterate the massplot up by one for that mass.
- To remove an errant mass iteration, use ctrl-click (PC) or cmd-click (Mac) on the same number.
- Important note: The Mass Histogram is attached to all groups in the same location. Thus when a student adds to or deletes from the Mass Histogram,the student is doing this for everyone at the masterclass institute. Thus students will see the Mass Histogram seem to change by itself. This is the normal result of other students working on it.
- The total of number of events at each mass is then automatically transferred to the mass plot in the Results tab.
Enter masses the Mass Histogram for the entire institute (location). Refreshing will show any newly added masses.
Numerical results can be seen in the Results page for the institute (location).
Presentation of results
The
Sample questions
In discussion, the moderator might ask students
- How many
In the videoconference, students might ask questions like
- Why are the widths or heights or numbers of peaks different from one Institute to the next?
- Now that the Tevatron is shut down, what do you do at Fermilab?
- Why did you become a physicist?
...and better questions which only students can create.
Moderators
Fermilab-based moderators should refer to the FNAL Masterclass 2020 Moderators page (update link for 2020).
All moderators should note the following:
As long as all groups use CIMA, moderators do not need to look for uploads from any of the masterclass institutes or make histograms on their own. There is one "Table" for each masterclass institute (location) participating in a single videconference. Each institute has a Mass Histrogram and a Results page.
- Mass Histogram - students use "Events Tables" to record W or Z candidates, e or µ events, Higgs candidates, and "zoo" events. Choosing Z or Higgs candidates results in masses popping up, which students transfer into the Mass Histogram.
- Results - numbers of different types of particles are automatically transferred here; e:µ and W+:W- are calculated for the whole institute.
The moderators will access the Admin page of CIMA to view these and share them on Vidyo. They will also view and share the combined Mass Histogram and combined Results for all institutes participating in their videoconference.
To get to the appropriate places, moderators only should go to the CIMA Admin page.
Then:
- Log in. The user name and password will be sent separately.
- Please do not touch anything above Manage Tables.
- Go to the part of the page under the Manage Tables heading.
CIMA Admin page. This shows how to choose results for 10 March.
You are now on the Results tab for combined results for all institutes in the videoconference. To choose results for a particular institute (and you should do this for each one), go to the small down arrow next to All at the top to get a pull-down for all institutes and for each individual institue. Choose Mass Histogram to switch the the mass plots.
Pull-down menu for Results or Mass Histogram for each institute or all institutes.
Mass plot for one institute.
Combined mass plot for all institutes.
Moderators should discuss the results from each institute and the overall results with the students, making sure to stay within time constraints. If an institute does not use the online spreadsheet, the mentor for that institute should show their mass plot and results using Vidyo desktop sharing.
Material
for students and teachers:
- Classroom prep activities
- Rolling with Rutherford at /data-portfolio/activity/rolling-rutherford
- Quark workbench at /data-portfolio/activity/quark-workbench
- Calculate the mass of the top quark from Tevatron data at /data-portfolio/activity/calculate-top-quark-mass
- Calculate the mass of the Z boson from LHC data at /data-portfolio/activity/calculate-z-mass
- Aid in masterclass
- Analysis presentation at /sites/default/files/cmsanalysis2016_v0.ppt
- CMS Masterclass "Cheat Sheet" at /sites/default/files/cmscheat_wzh16_v0.pdf
- Student webcast on using iSpy-webgl: View on YouTube.
- iSpy/CIMA webcast: View on screencast.com.