CMS WZH Measurement
- Description
- Requirements for hardware and software
- Outline of the day
- Student procedure
- Presentation of results
- Sample questions
- Moderators
- Material for students and teachers
- Low/No Bandwidth Supplement
- Students use event display of (mostly) leptonic decays to determine
- lepton ID (electron, muon),
- likely particle ID (W, Z, zoo, Higgs),
- charge if W, using curvature of electron or muon tracks,
- Students use particle counts to find e:µ and W+:W- ratios.
- Students create mass plots. They find the mass of the Z boson and a possible Higgs signal but also other peaks in the mass plot to reveal additional particles.
- Students use the iSpy-online event display (or iSpy-dvd if there is insufficient internet bandwidth) and the CMS Instrument for Masterclass Analysis (CIMA). Instructional screencasts are available for iSpy-online and iSpy-dvd (on DVD).
Requirements
for hardware and software
Online:
- Reliable, high-speed internet connection
- Up-to-date version of Firefox, Chrome, or Safari
- Masterclass DVD 2015
- A browser that supports the FileReader API: Firefox 3.6+, Chrome 6+, IE 10+, Safari 6+, Opera 11.5+
- Spreadsheet (e.g. MS Excel, OpenOffice) may be needed
- Work out a system for data transfer from student level to institute level and then for transmission of results to moderators
- Note: Moderators cannot show institute mass plot results in the videoconference. The mentor should share the institute mass plot through shared desktop. (In the Fermilab-based masterclass, there is an Indico page for the videoconference and the mentor can upload material such as a mass plot by means of a modification key.)
Outline of the day
- Arrival/Registration (~30 min)
- Cloud chamber, e/m apparatus, or other "gateway experience" apparatus setup for students to inspect
- Start and Ice-breaker activity (~30 min)
- Students in small groups create 1-2 good questions about particle physics and/or LHC. Where practical, groups should be made of students from different schools.
- Mentor presentation
- Template (~60 min, including Q&A)
- Tour of facilities/labs/cool stuff (~45 min)
- Analysis preparation (1-2 teachers facilitate; ~60 min, including Q&A)
- Presentation
- CMS data analysis slides
- ATLAS data analysis slides
- Guided practice with discussion
- Lunch with a physicist (~60 min)
- Data Analysis (~90 min)
- Pre-conference (~30 min)
- Students and mentor discuss meaning of analysis results.
- Students and mentor discuss questions for other institutes.
- Revisit questions from ice-breaker, discuss which to ask in video conference.
- Designated IT expert preps video connection.
- Videoconference (~30 min)
- Greetings
- Presentation of results
- Discussion of results
- Q&A
- Summing up and evaluation (~15 min)
- Each pair of students analyzes a set of 100 events
- For each event, distinguish between electron and muon decay and between W+, W-, Z candidate, Higgs candidate, and zoo.
- Record into CIMA.
- Be prepared to discuss in Masterclass Institute and in videoconference; prepare good questions.
Student procedure
It is important to carefully note the following:
- The new CIMA data analysis tool is different from the previous spreadsheets. Mentors and tutors need to be familiar with CIMA in order to guide the students successfully.
- The description below is for the current version of iSpy, which is still recommended for CMS masterclasses. There is a new, more capable WebGL version in testing. Select groups may choose to use this new version. To do so, they should study both the procedure below and the Event Display Supplement at http://leptoquark.hep.nd.edu/~kcecire/drupal_lib/files2015/masterclass2015-ispywebgl.pdf and then try the new version before the masterclass.
Mentors should guide students to follow these procedures for the use of iSpy and CIMA:
- Pairs of students are assigned sets of 100 events to analyze in iSpy-online or iSpy-dvd.
- Event sets are found in the event display (http://www.i2u2.org/elab/cms/event-display) by choosing the folder icon (top left).
- A window appears. On the right side, students first choose "masterclass-2015" and then their event set (labelled masterclass_1, masterclass_2, etc.).
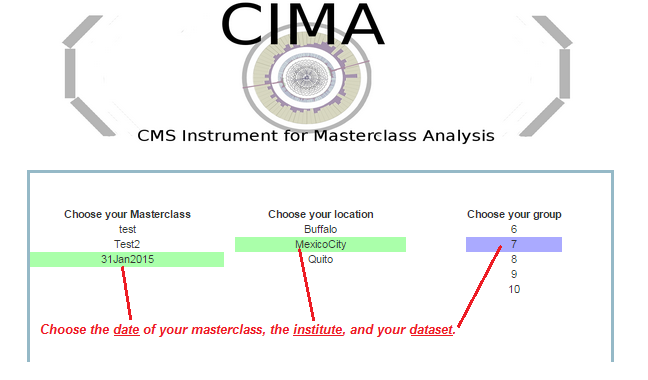
- Students also open CIMA and then find their masterclass by date ("Choose your Masterclass") and then institute ("Choose your location"). They then choose the number of their event set ("Choose your group"): this is the same number as the event set in iSpy.
- Notes on CIMA for students:
- All institutes are strongly encouraged to use CIMA rather than a local spreadsheet.
- There are two copies of CIMA for students:
- Production version for students at https://www.i2u2.org/elab/cms/cima/index.php
- Please use the production version of CIMA for your masterclass. It will have your date and your institute to choose from and will be at the URL for the masterclass videoconference inn which you will participate. If needed, Google spreadsheets will be provided online in case of any problems with CIMA.

- Lepton ID (electron, muon). This is to characterize the event, not a individual particles.
- If the event has one muon track (long, red) or two muon tracks (actually likely a muon-antimuon pair) it is a single muon event.
- If the event has one electron track (short, yellow) or two electron track (actually likely an electron-positron pair) is is a single electron event.
- Likely particle ID (W, Z, zoo, Higgs)
- W candidate appears as a single electron track or muon track and a missing Et vector (yellow arrow, always transverse to beamline)
- Z candidate appears as 2 muons or 2 electrons; it is not always a Z. It may or may not have missing Et in the event.
- Suspected Higgs (H); these are rare but noteworthy. Events show as
- H→ZZ: 2 electrons and 2 muons, or 4 electrons, or 4 muons.
- H→γγ: no electron tracks but 2 large energy deposits (seen as towers) in ECAL.
- Zoo events are "none of the above" but there can be interesting events among these.
- Charge if W, using curvature of electron or muon tracks. It helps to select the X-Y view and "orthographic mode" (the "flat cube" button), zoom in and to use a paper straight edge.
- Mass if Z or H candidate (taken from CIMA)


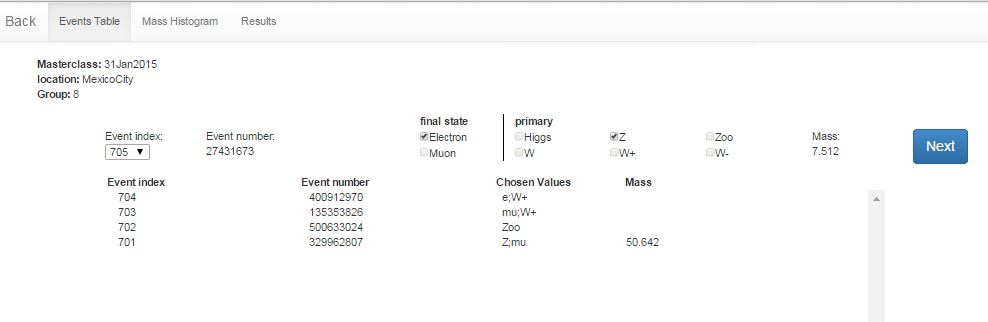
- Choose whether it is an electron or muon under "final state".
- If the event is a Higgs or zoo candidate, no final state is chosen.
- Choose the most likely parent particle under "primary". If it is a Z or Higgs candidate, a mass will appear. If it is a W or zoo, no mass will appear as we do not include these in the mass plot. If a W and a charge can be determined, choose either W+ or W- instead of just W.
- Choose next. This puts the data below in a line corresponding to the Event Index number.
- In the case of an error, clicking the data line will erase it; you can then try it again.
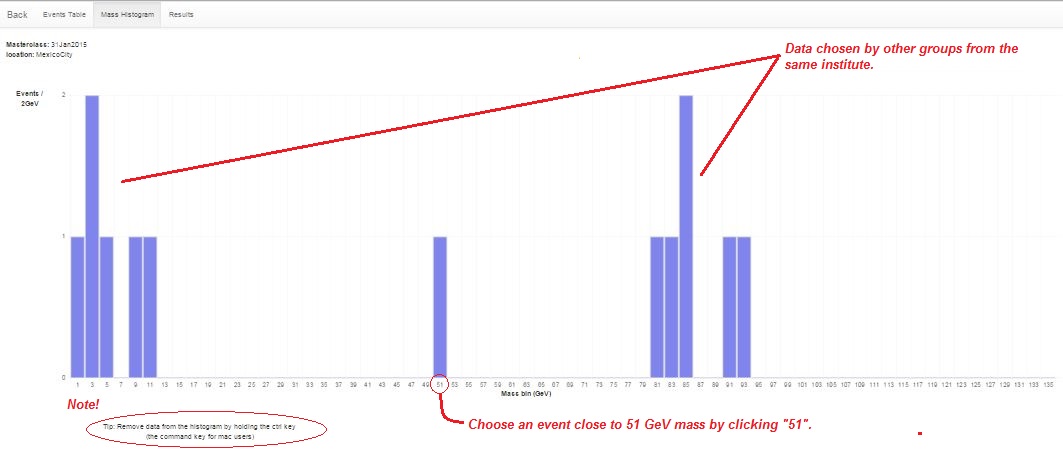
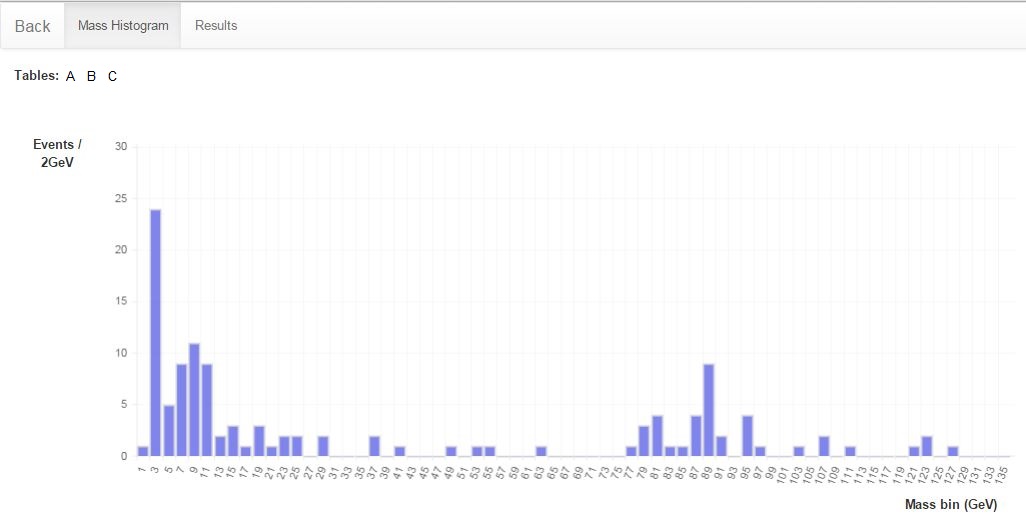
- When a mass is shown in the line for an event, the students should record it in the Mass Histogram. The student should:
- Choose "Mass Histogram" at the top.
- Zoom to get a good size for the massplot, if needed, using ctrl-minus (PC) or cmd-minus (Mac).
- The numbers on the horizontal axis are the values of the middle of the bins of width 1 GeV. Select the bin by clicking. This will iterate the massplot up by one for that mass.
- To remove an errant mass iteration, use ctrl-click (PC) or cmd-click (Mac) on the same number.
- Important note: The Mass Histogram is attached to all groups in the same location. Thus when a student adds to or deletes from the Mass Histogram,the student is doing this for everyone at the masterclass institute. Thus students will see the Mass Histogram seem to change by itself. This is the normal result of other students working on it.
- The total of number of events at each mass is then automatically transferred to the mass plot in the Results tab.
Presentation of results
Sample questions
- How many peaks are there in the mass plot?
- Where is the Z peak? What is the mass of the Z boson?
- What do the other peaks mean?
- Is there anything interesting in the 120-130 GeV range? What is it?
- What is the ratio of electrons to muons? Is it close to what we should expect?
- What is the W+:W- ratio? What should it be?
- Why are the widths or heights or numbers of peaks different from one Institute to the next?
- Why do different Institutes get different ratios? How did they identify electrons or muons or W candidates or Z candidates or zoo events? How did they measure charge for W candidates?
- Now that the Tevatron is shut down, what do you do at Fermilab?
- Is it boring at CERN when the LHC is not running?
- Why did you become a physicist?
Moderators
- Mass Histogram - students use "Events Tables" to record W or Z candidates, e or µ events, Higgs candidates, and "zoo" events. Choosing Z or Higgs candidates results in masses popping up, which students transfer into the Mass Histogram.
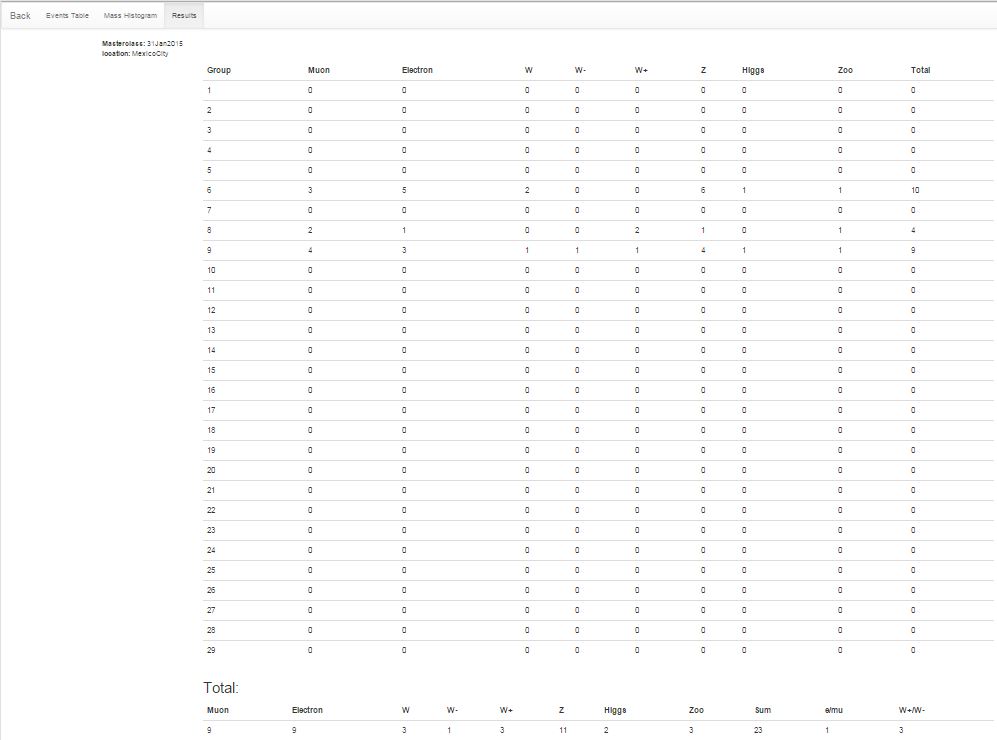
- Results - numbers of different types of particles are automatically transferred here; e:µ and W+:W- are calculated for the whole institute.
The moderators will access the Admin page of CIMA to view these and share them on Vidyo. They will also view and share the combined Mass Histogram and combined Results for all institutes participating in their videoconference.
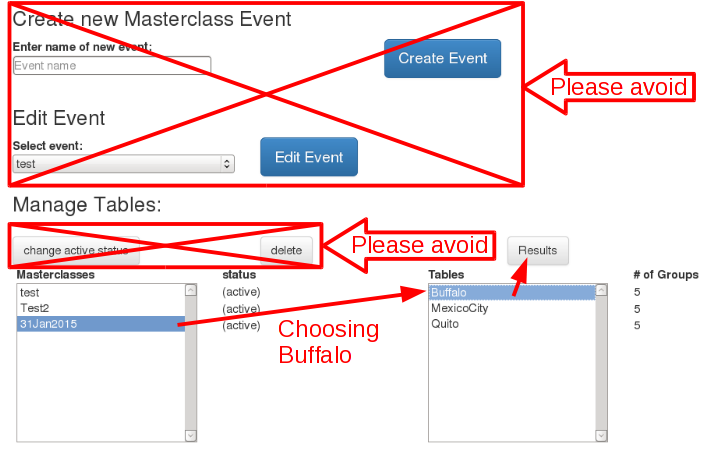
- Go to the CIMA Admin page. There is also a backup/development copy.
- Log in. The user name and password will be sent separately.
- Please do not touch anything above Manage Tables.
- Go to the part of the page under the Manage Tables heading. To view the Results and Mass Histogram pages for one institute: choose the date under Masterclasses and the institute under Table and then choose the Results button. To view the combined Results and Mass Histogram for all institutes that day: choose the date under Masterclasses but do not choose anything under Table and then go to the Results button.
New feature!As of 12 March 2015 we have very handy feature in the admin page of CIMA to help moderators handle swtiching between Institutes and combined Results. Here is how it works:
You do not have to back up to the main menu to switch from one Institute to another. It works just as well on the Mass Histogram. |

Material
for students and teachers:
- Classroom prep activities
- Rolling with Rutherford at /data-portfolio/activity/rolling-rutherford
- Quark workbench at /data-portfolio/activity/quark-workbench
- Calculate the mass of the top quark from Tevatron data at /data-portfolio/activity/calculate-top-quark-mass
- Calculate the mass of the Z boson from LHC data at /data-portfolio/activity/calculate-z-mass
- Aid in masterclass
- Analysis presentation at /sites/default/files/cmsanalysis2015_v0.ppt
- CMS Masterclass "Cheat Sheet" at http://leptoquark.hep.nd.edu/~kcecire/mclib/files2014/CMScheat_wzh_v0.doc.
Low/No Bandwidth Supplement
In the case where bandwidth or connection to CIMA is a problem, please use these alternative steps:
- Use the DVD version if possible.
- Distribute the spreadsheet mc2015dvd_students to students. It is in the “more” folder of the DVD.
- Students should find their dataset in the Datasets tab. For each event they examine in iSpy-dvd, students should:
- place a “1” (and only a “1”) under electron or muon only if the event is a W- or Z-candidate.
- place a “1” (and only a “1”) under W+ cand, W- cand, W cand, or Z cand only if the event is a W- or Z-candidate.
- place a “1” (and only a “1”) under “zoo” if the event cannot be characterized.
- place a “1” (and only a “1”) under Higgs cand only if the event is a Higgs (diphoton or 4-lepton) candidate.
- If the student characterizes the event as a Z or Higgs candidate, a mass in GeV will appear in the rightmost column. The student should then go to the Results tab and place a “1” (and only a “1”) above the mass (rounded to the nearest odd number) in the cell directly above the mass in row 33. If this cell is filled, the student goes to the next one up. The student then returns to the Datasets tab and continues to work.
- Once the data analysis has stopped, the student should find the total numbers of electrons, muons, W+, and W- from the bottom of their dataset and write these down. They should also write down the total non-zero number of events for each mass (with the mass) from the Resutls tabs. These numbers must be reported to the mentors. Students may use the Data Report Form found in the “more” folder of the DVD.
- A mentor or a teacher can then type in the totals in the mc2015dvd_mentors spreadsheet, found in the “more” folder of the DVD. The will create a combined e/μ, W+/W-, and mass plot for the whole institute.
The results cannot be combined with the other masterclass institutes in a videoconference but they can be shared via the Vidyo desktop. Upon request, a Google version of the mentors spreadsheet can be made to make entering data much quicker. Send an e-mail to kcecire@nd.edu for this.