World Wide Data Day ATLAS CMS Registration Videocons
Introduction
In this measurement, students find the directional distribution of muon track in CMS. They are searching for:
- anomalies in the distribution that might indicate a bias in the detector or in the data
- clues about particles that result from collisions behave in CMS and the LHC.
Students should be divided into small groups, preferably of two. Each group should have a tally sheet. They should study the sheet before beginning.
Students! Watch these videos!
Student Procedure
- Work with a partner: teams of two are best for this measurement.
- Open iSpy-w2d2 and find the masterclass data. View the screencast for help. (There is a small flaw in the screencast - can you find it?)
- Choose the dataset assigned by your teacher. If you do not have a teacher or a physicist working with you, e-mail us for assistance choosing a dataset - the sooner the better.
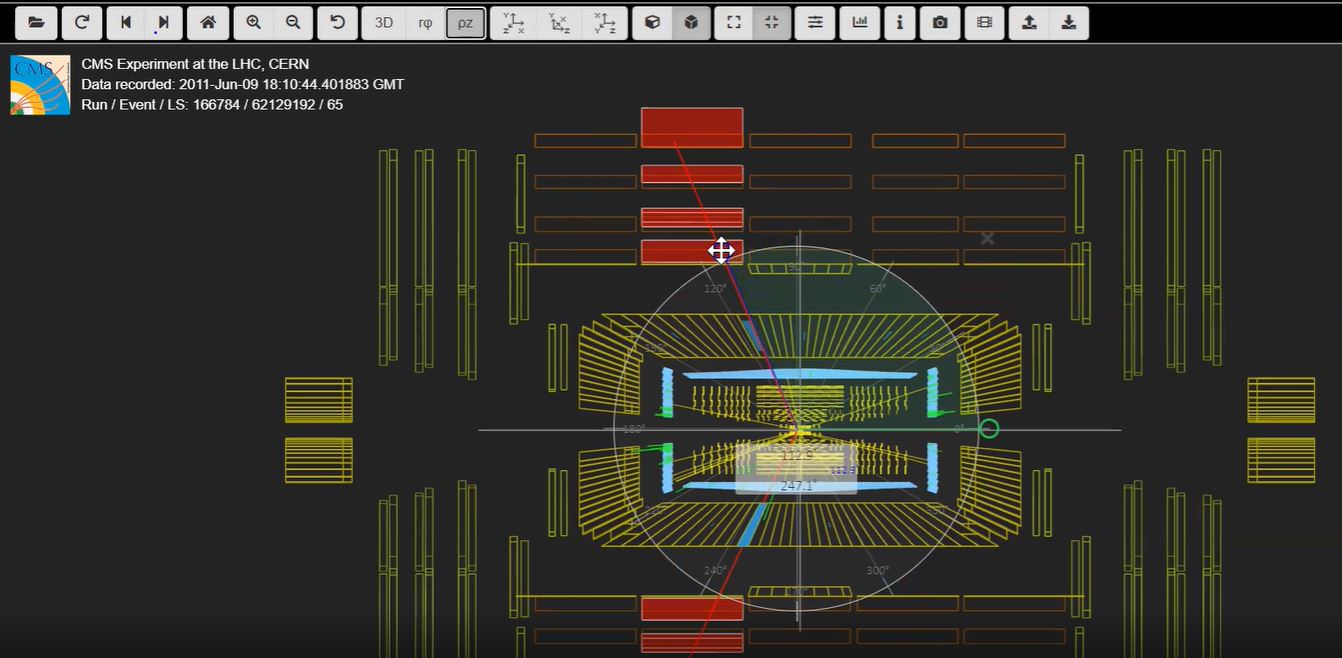
- Advance through the events, only stopping for dimuons. Dimuon events have two long red tracks that pass beyond ECal (the smaller blue cylinder in the event image) and usually as far as or beyond the HCal Outer section (the larger yellow cylinder). Outside HCal Outer, the tracks are often accompanied by red boxes that represent muon chambers that the tracks intersected. All else is treated as background.
- For each dimuon event, go to the look at each muon track in the forward view - this is found with one of these buttons at the top of the display: "rphi view" (preferred, marked rφ) or "YX Plane" (leftmost button with three axes). For each of the two muons, measure angle PHI anticlockwise from the +x axis. The x- and y-axes should appear in this view. PHI is always positive and runs all the way around the beamline (z axis) from 0 to 360 degrees.
- Next go to to the "rho z view", marked as ρz to measure THETA. (You must use this view.) Measure THETA for each muon as the shortest angle from the +z (right central) axis. THETA is always positive and runs from 0 to 180 degrees.
- Pro tips:
- The very strong magnetic field in CMS bends the paths of muons, especially when those muons have relatively little energy or momentum. To measure PHI or THETA, measure to the tangent to that curve closest to the central vertex where the two muon tracks start.
- Sometimes it is hard to tell if you have 1 or 2 muon tracks in the one view, e.g. ρz. Check the other view, e.g. rφ. If it has only one muon track, skip to the next event.
- Place tick marks for each angle measured in the tally sheet, using the closest values that appear in the sheet. (For example, 17 degrees is closest to 10 and 23 degrees is closest to 30.) This will allow us to record numbers of events in bins representing 20 degree intervals.
- When you are finished with your dataset, add up the number of tick marks in each bin of PHI and each bin of THETA and make a histogram of each on the second page (or reverse side) of your tally sheet sheet,
- Prepare to report your results to the class.
Teacher Procedure:
- Before you start, read the Student Procedure and Notes for Teachers.
- Open the Worldwide (Google) Spreadsheet and go to the CMS tab. Read the warnings!
- Look at the datasets other school groups have already selected for their measurements in column D. While some overlap may be inevitable, try to select datasets for your students that are as little used as possible.
- Help students as they work from the Student Procedure above.
- As they finish, they should add their numbers to classroom histograms of PHI and THETA.
- Record the same final numbers from your class histogram in your line of the Worldwide Google Sheet in the appropriate columns. Note that the numbers in line 8, columns E-AF, are the angles in the center of each 20 degree bin.
- Be sure to record your dataset in column D.
- Take a look at (but do not edit or interfere with) the plots at the bottom of the page in the spreadsheet (scroll down to line 158). Discuss results you see in class or in your group. Prepare questions for your videoconference.
- Connect to the videoconference via Zoom. Zoom coordinates will be sent prior to World Wide Data Day..
If working with students remotely:
- Students may use a Google tally sheet online or download it in DOCX, ODT, or PDF. In the former case, students will be prompted to make their own copies of that sheet.
- Students should either send you their results or record them in the Local Google Sheet. The Local Sheet will automatically make the Class Histograms. If not using this, you should make a class histogram you can display online from the results they send.
- You will need to transfer the totals from the results your students send you to the Worldwide Sheet, just as you would if the students were in class.
- You should schedule perhaps 2 or more videoconferences with the students for instruction and coaching. They should watch the instructional screencasts for students before you have your first videoconference.
Images:
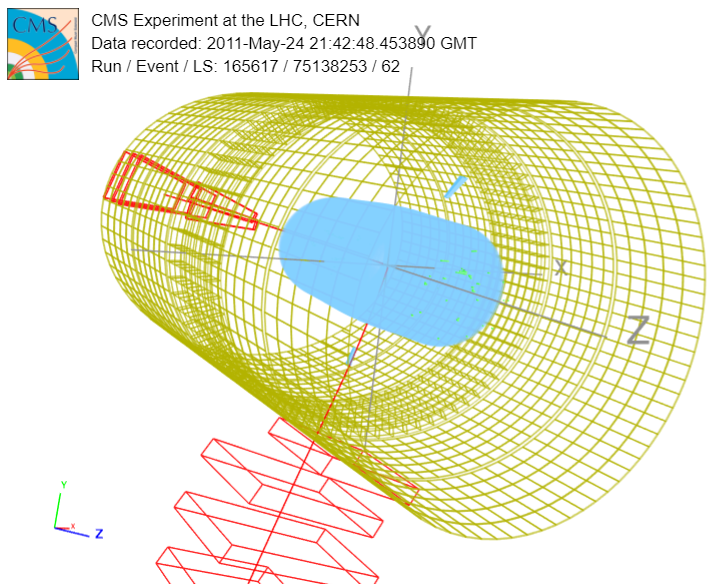 | 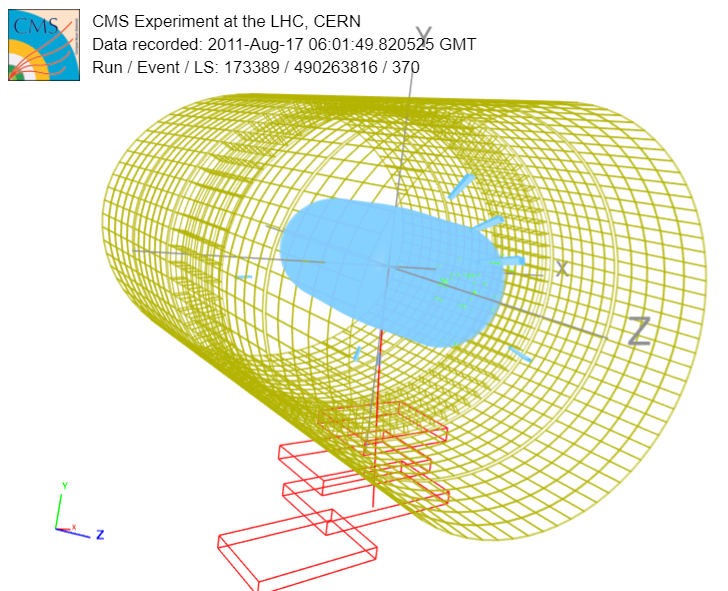 | 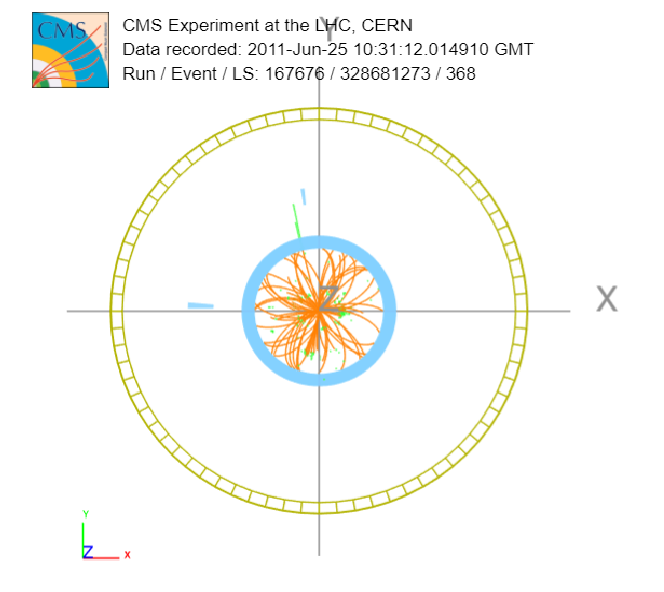 |
Three different events in CMS. The first (left) is a dimuon event and the other two are not. The last (left) has many low energy tracks in the center – these are not muons and are not normally shown.
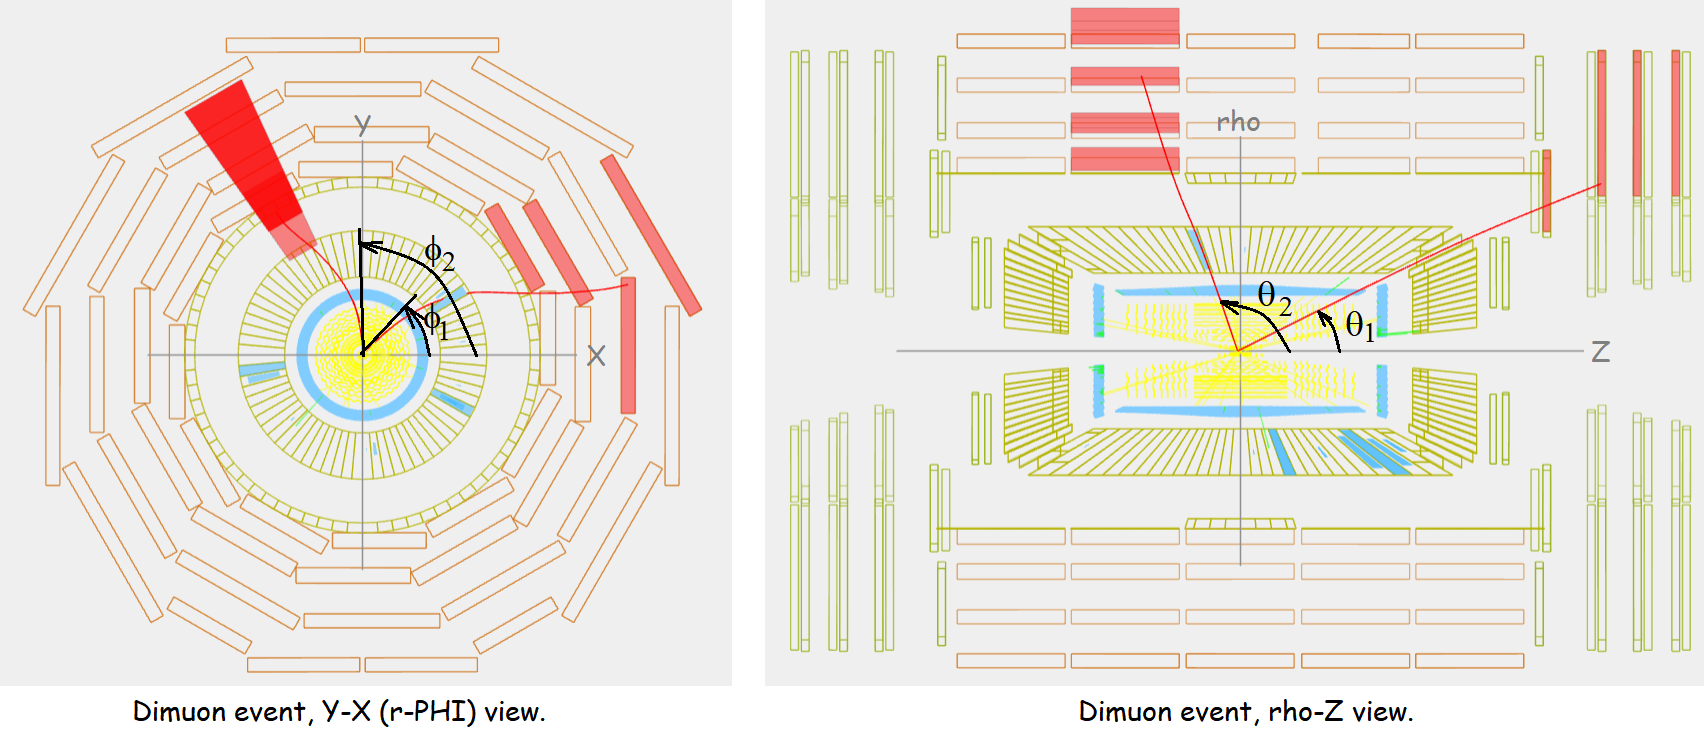
PHI-1, PHI-2, THETA-1 and THETA-2 in two views of the same event. Also note labels for tangent lines, muons tracks, and detector features.