


Introduction
In this measurement, students find the directional distribution of muon track in CMS. They are searching for:
- anomalies in the distribution that might indicate a bias in the detector or in the data
- clues to how particles that result from collisions behave in CMS and the LHC.
Students should be divided into small groups. Each group should have a tally sheet. They should study the sheet before beginning.
Student Procedure
- Open the W2D2 Report (Google) Spreadsheet and go to the CMS tab. Read the warnings!
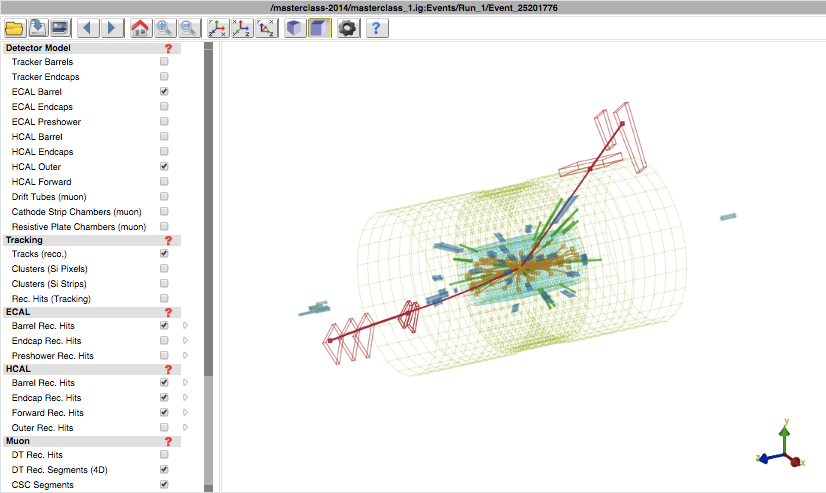
- Open iSpy-online and find the masterclass-2015 data. View the screencast for help.
- Choose the dataset assigned by your teacher. If you do not have a teacher or a physicist working with you, e-mail us for assistance choosing a dataset - the sooner the better.
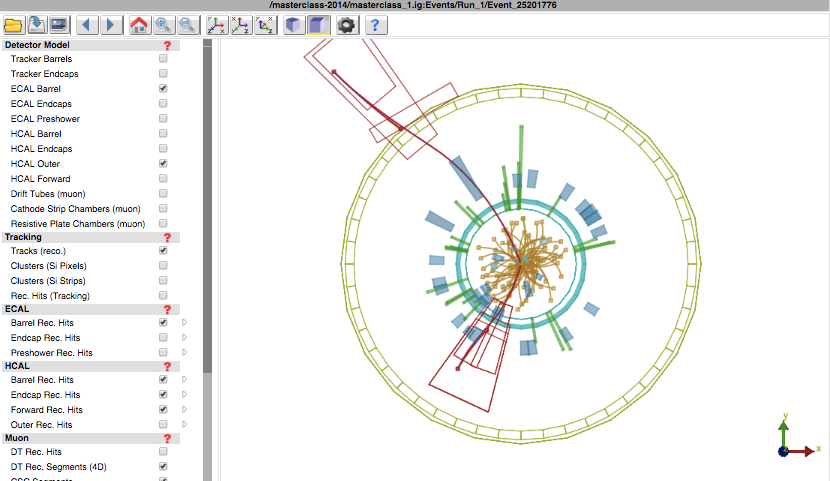
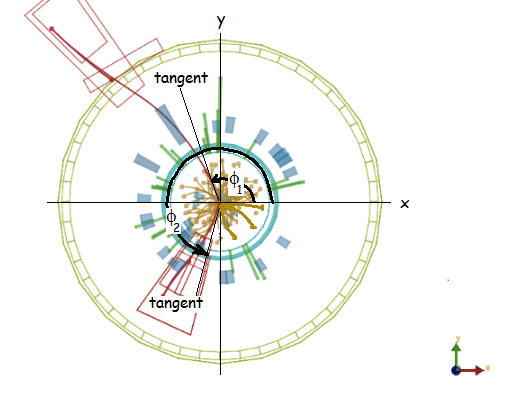
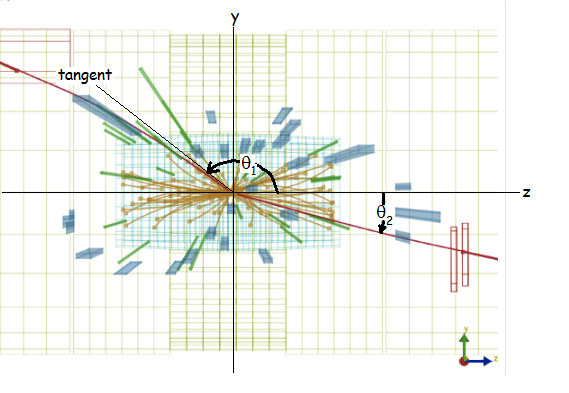
- For each dimuon event, look at each muon track in the forward (x-y) view on the left and measure angle PHI from the +x axis. PHI runs all the way around the beamline (z axis) from 0 to 360 degrees. Then switch to the side (y-z) view on the right and measure angle THETA in the same way for each muon track. THETA runs from 0 to 180 degrees either clockwise or anti-clockwise from the +z axis, whichever is the shortest path to the track. Note that you will need a protractor to make the measurement and that you should be careful to measure the angle in x-y from the tangent to the curvature of the track closest to the vertex or center of the event. (There is another way but it requires some manipulation and calculation.)
- Place tick marks for each angle measured in the tally sheet, using the closest values that appear in the sheet. (For example, 17 degrees is closest to 10 and 23 degrees is closest to 30.) This will allow us to record numbers of events in bins representing 20 degree intervals.
- When you are finished with your dataset, add up the number of tick marks in each bin of PHI and each bin of THETA and make a histogram of each on the back of your sheet, Then record the same numbers in your line of the W2D2 Report Spreadhseet. Be sure to list the dataset under Column D; if you stopped before 100 events, add "to" and the event number of your last event (e.g. "masterclass_1.ig to 523462752") so that someone else can consider picking it up from that point if they want to.
- Take a look at (but do not edit or interfere with) the plots at the bottom of the page in the spreadsheet (scroll down to line 158). Discuss results you see in class or in your group. Prepare questions for your videoconference.
Images:
Choose the image to enlarge: