External Links:
- MINERvA Masterclass website
- MINERvA masterclass guide
- Neutrino Masterclass Library
- International Masterclasses
- PDF of this page
MINERvA Masterclass Measurement
Created by K. McFarland, K. Cecire, R. Fine, M. Carneiro, N. Tagg, QuarkNet LHC-Neutrino fellows
The MINERvA masterclass measurement is supported for International Masterclasses.
Contents:
- Description
- Requirements for hardware and software
- Outline of the day
- Pedagogy
- Student procedure
- Presentation of results
- Sample questions
- Moderators
- Material for students and teachers
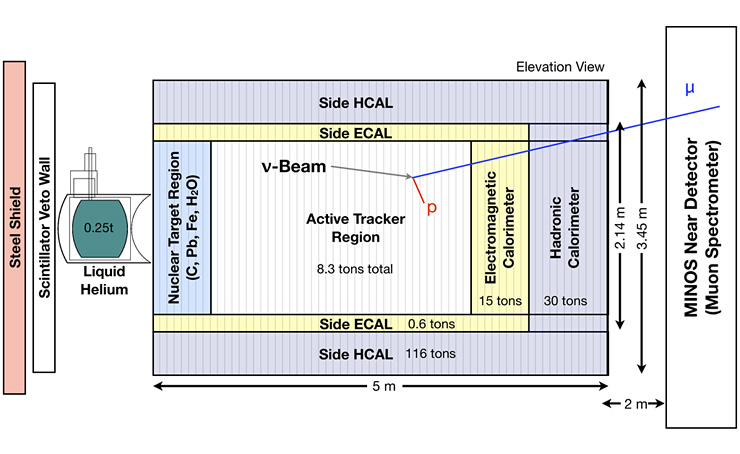
(Credit: Fermilab)
Description
The MINERvA masterclass measurement enables students to examine actual events from the MINERvA detector in the MINOS neutrino beamline at Fermilab and draw conclusions based on categorization of the data and the kinematics of the interactions. There are both background and signal events. In each signal event, a neutrino penetrates a nucleus in a carbon target and undergoes a weak interaction with a neutron in that nucleus:
νμ + n0 → μ- + W+ + n0 → μ- + p+ .
In short, the neutrino interacts with the neutron to become a muon, causing the neutron tobecome a proton. (Note the net change in charge is zero.) The interaction is mediated by a W boson. The resulting muon and proton exit the nucleus with considerable momentum, which came from the original neutrino. While MINERvA cannot directly detect the neutrino, it can detect and measure the kinematics of both the muon and the proton that emerge from the interaction.
Students can find this kinematic information the ARACHNE, the MINERvA event display that they use to visualize the events. The students can then put this inofrmation into a spreadsheet which applies conservation of momentum to give the momentum of the system prior to the interaction in three dimensions. The z-direction is, in the coordinate system of the experiment, the initail beam direction. The initial momentum in z is the momentum of the neutrino plus the momentum of the neutron, if any, before the collision. The momenta in x and y, then, if there is any, would be due solely to the neutron.
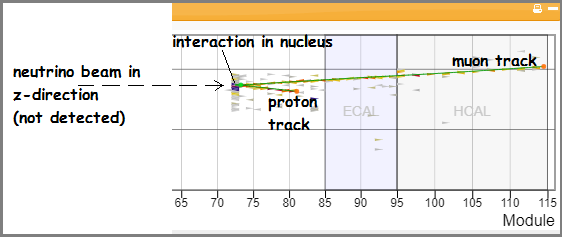
Part of MINERvA signal event as seen in ARACHNE.
For more details, see Undertanding MINERvA Masterclass Results.
Software/Hardware
The entiire MINERvA masterclass measurement runs online in a browser. Masterclass leaders should test ARACHNE (including choosing a track and copying kinemetics) and Google Sheets in the computers and browsers to be used ahead of time.
Masterclass General Plan
All masterclasses share a pattern for the masterclass day. Neutrino masterclasses are no different in this case. The main elements of the plan are:
- Intro/warmup
- Introduction to the physics (neutrino physics , weak interactions, MINERvA experiment)
- Lab tour, if available
- Introduction to the masterclass measurement (ARACHNE, student spreadsheet, how to measure)
- Lunch with physicists
- Masterclass measurement
- Discussion of results
- Videoconference.
For neutrino masterclasses in particular, these resources will help:
- Particle cards activity
- Template for introduction to neutrino physics
- Template for introduction to measurement
- Notes on measurement (below)
- Notes on videoconferences.
Pedagogy
Enduring Understanding:
Indirect evidence provides data to study phenomena that cannot be directly observed.
Objectives:
- Apply conservation of momentum and energy to measure the approximate energy of a neutrino beam from the Fermilab accelerator complex.
- Apply conservation of momentum and energy to measure the properties of neutrons in nuclei of atoms in the target of a neutrino beam.
- Determine which events are signal events from which effective measurements may be made and which events are background that cannot be used for measurements.
Student Procedure
Screencast: https://tinyurl.com/minerva2019mc.
Here is the general outline of what the students do:
- Students work in pairs: two students to one computer.
- Each pair of students is assigned one mergedTuple (a 50-event dataset) from a Data Group assigned to their masterclass from the Data Analysis section of the MINERvA page of the Neutrino Masterclass Library,
- Students examine each event to determine if it is signal or background.
- If the event is determined to be backround, the students skip to the next event.
- If the event is a signal event, students move the cursor to each of the two tracks that emerge from the vertex and choose them. Momentum and kinetic energy data will appear for the track. Students can copy this data and paste it into an online spreadsheet.
- Note: Each masterclass is assigned a sheet in Google sheets. This means:
- The masterclasses that will meet together in a particular videoconference are all assigned the same instance of Google Sheets with a unique URL. Thus, if Boston, Prague, and Mazabuka are meeting in a videoconference, they get their own place Google Sheets.
- Each masterclass then has its own individual sheet inside that place. It is located as a tab at the bottom and is marked with either its assigned mergedTuples or the location, e,g, Boston. The students in Boston put their data, line-by-line, according to their mergedTuple and the Entry (event window, called a Gate), into their sheet in their tab. (This is pasted from the event display.)
- The spreadsheet will calculate pz (in the beam direction), py, px, and pt (transverse momentum calculated from px and py).
- The sheet combines student data to make a histogram of values of pz. Each value of pz represents the momentum of the neutrino before the interaction plus the moemntum of the taget neutron in the z-direction, if any. Guided by the masterclass leader, students can make a histogram of pz for all of their events.
- Students make similar measurements of px and py. Since they are transverse to the beam, they represent components of the momentum of the target neutrons only, if there is any.
Main steps for students in data analysis:
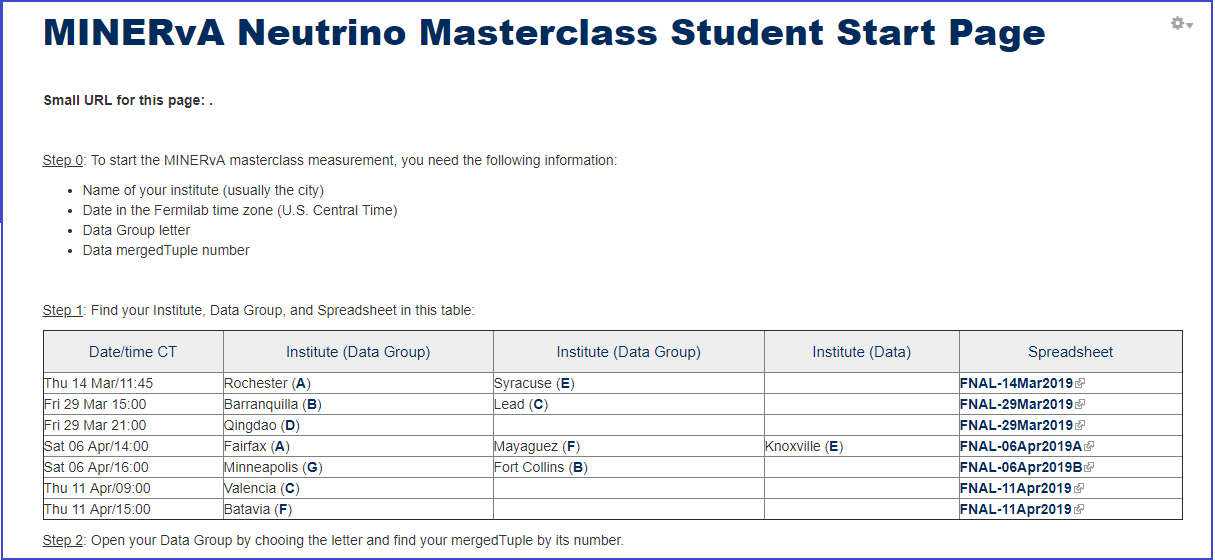
First step: Find events.
Each pair of students goes to the Student Start Page where they find their assigned Data Group and spreadsheet.
Second step: Open and use Arachne.
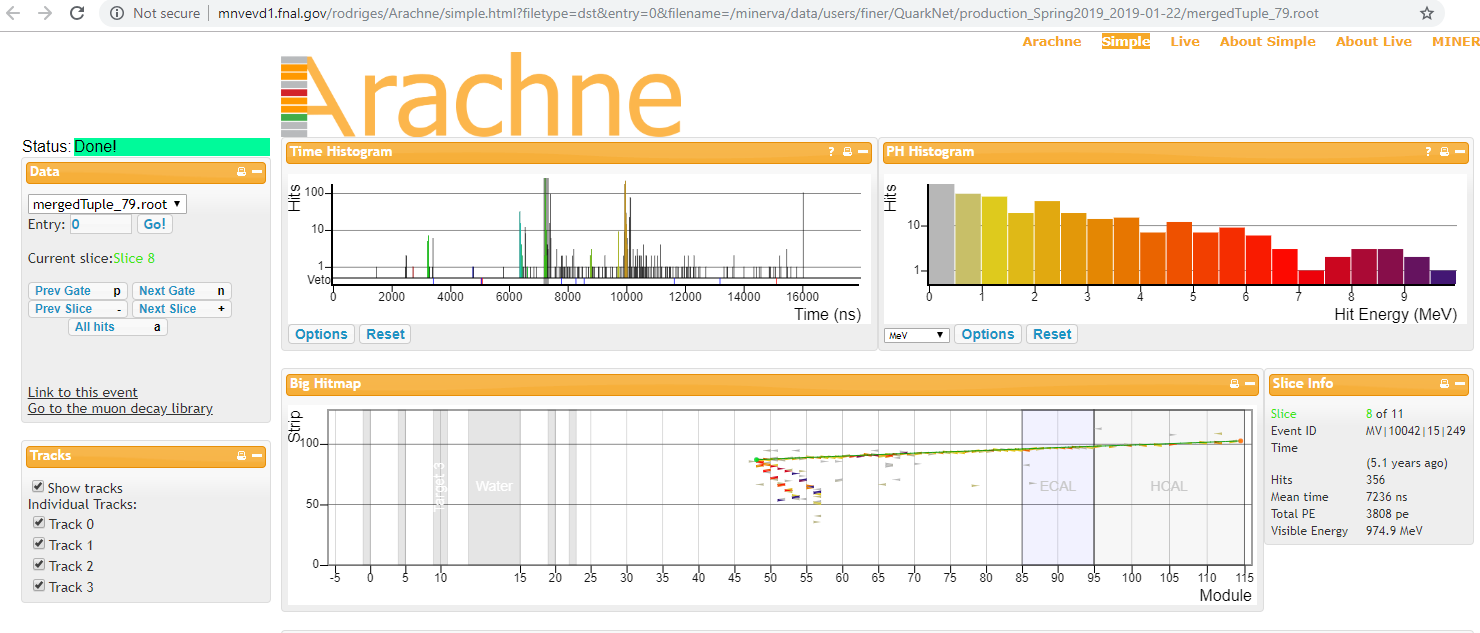
The masterclass leader should tell each pair of students their mergedTuple and help them find it in the data group and spreasdsheet . When they choose the mergedTuple, Arachne will come up in a new tab on the browser, which will open at the initial time Slice in the first Gate (shown as Entry 0; the next Gate will be Entry 1, etc.). In most cases, it will not initially show the event for which the students are looking. They must find it, if ti is there, by advancing from Slice to Slice within the Gate.
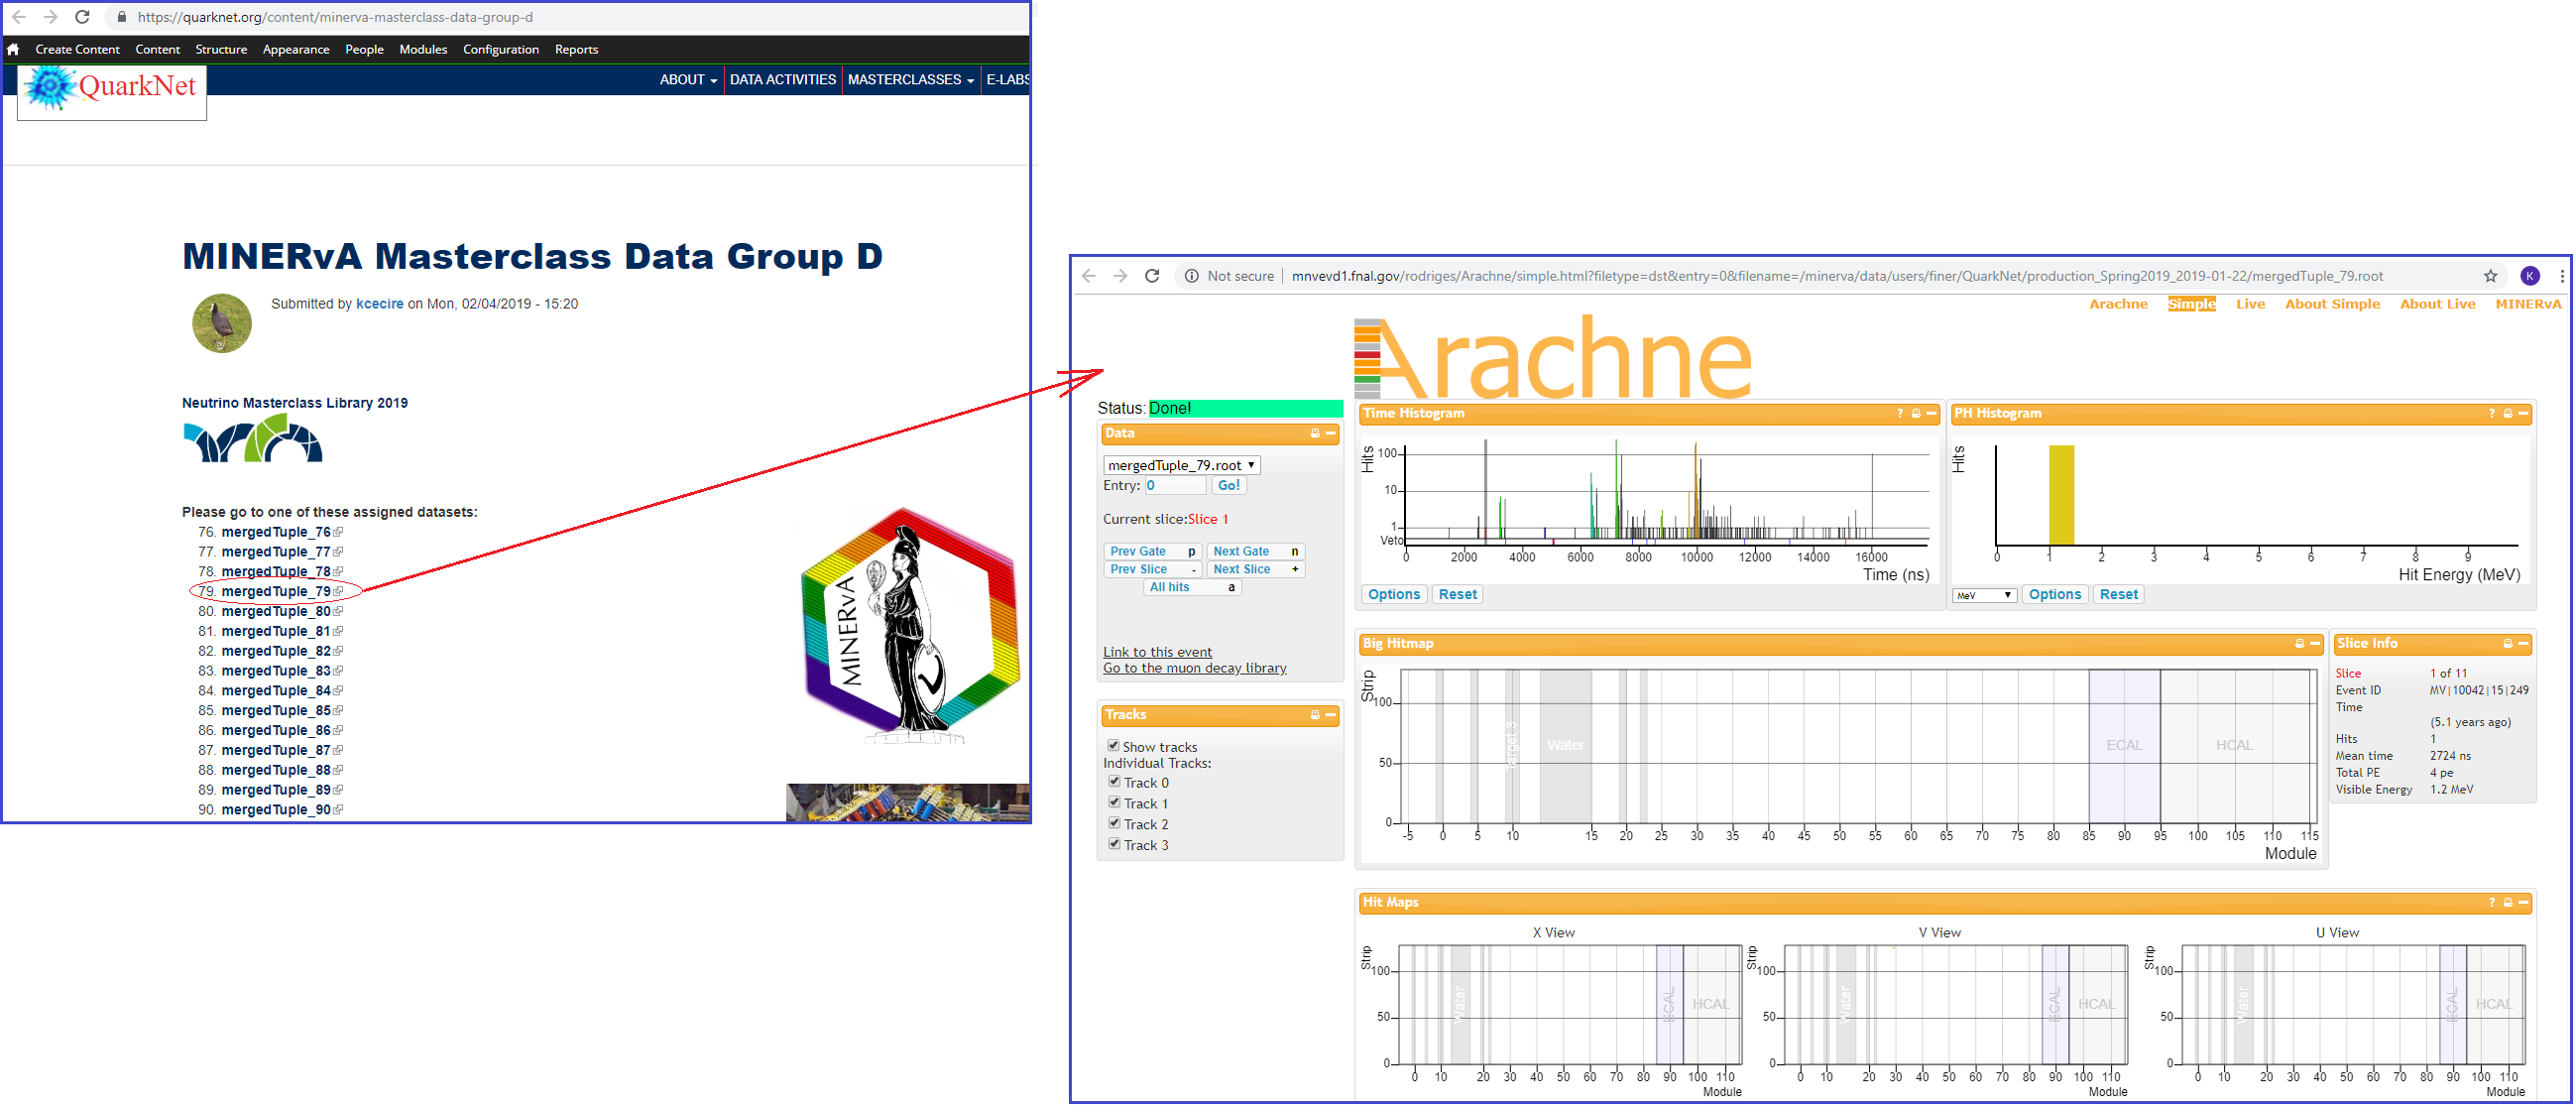
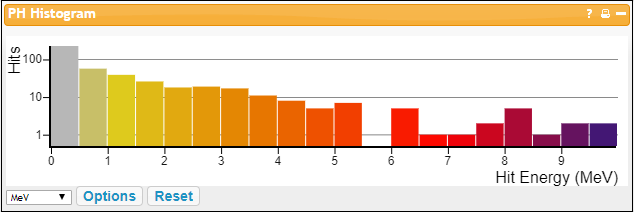
Students choose Next Slice, which moves a slightly later time in the Gate with each click. The progress can be seen in the Time Histogram in Arachne. Students advance the Slice until they find an instaance of one long track and one short track coming from a common vertex. This is the actual event theyi seek.
In this particular Gate, we find two possible events but both are background. The first has two short tracks rather than one:
That means is is not a signal event. Note that time has progressed to a little over 7000 ns in the Time Histogram. This is also background from a later Slice in the same Gate:
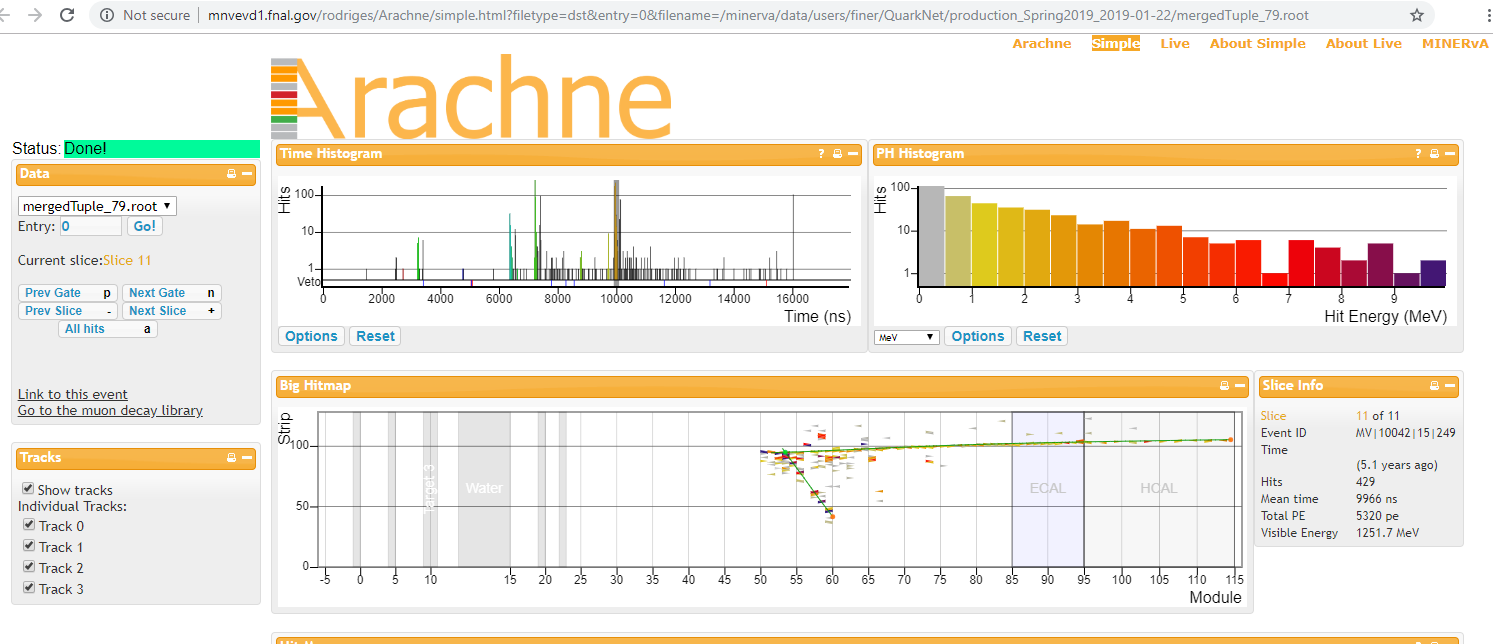
This not only has a an extra track which appears to go backwards (negative z direction) from the vertx but several lines of red and orange dots also coming from the same place.
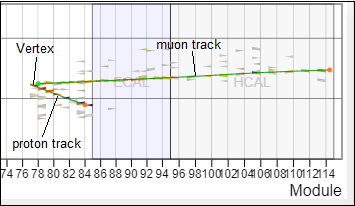
Here is an example of a good signal event:
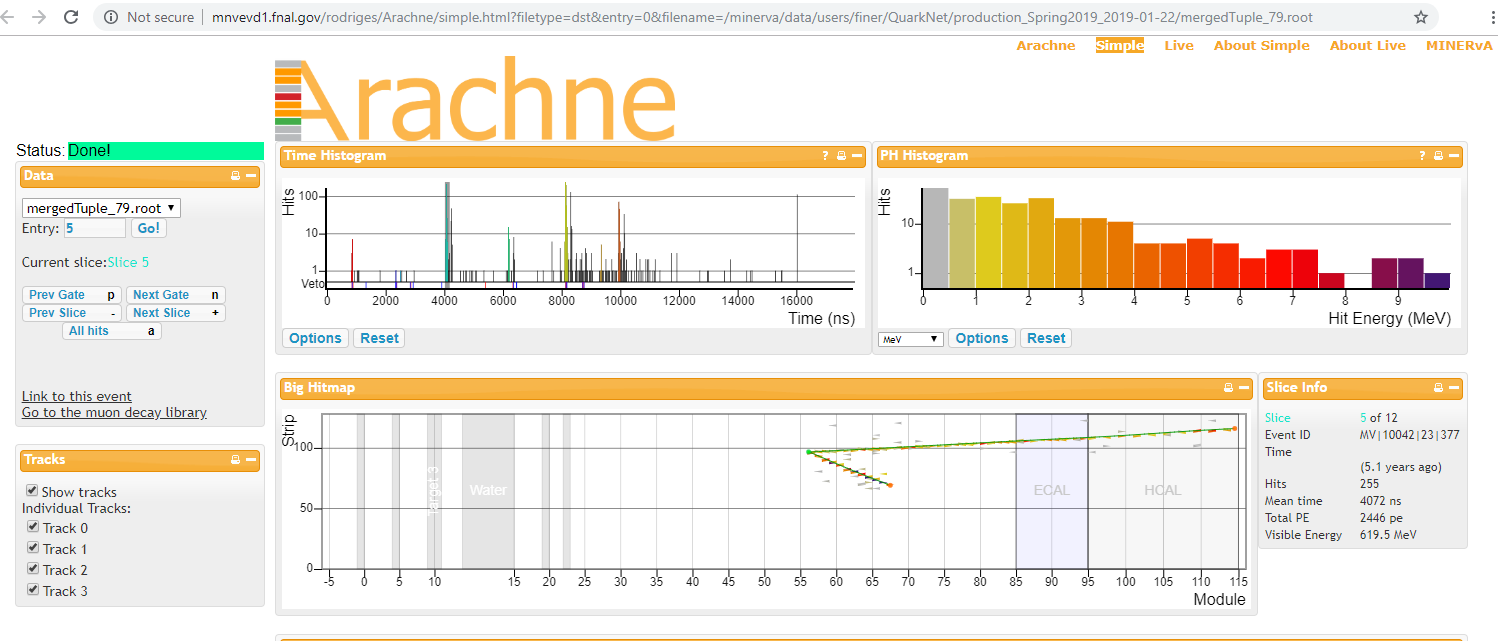
Note we are in a different Gate. This is close to a "classic" event: one clear long track for the muon and one clear short track for the proton. (The muons track is always the longer of the two.)
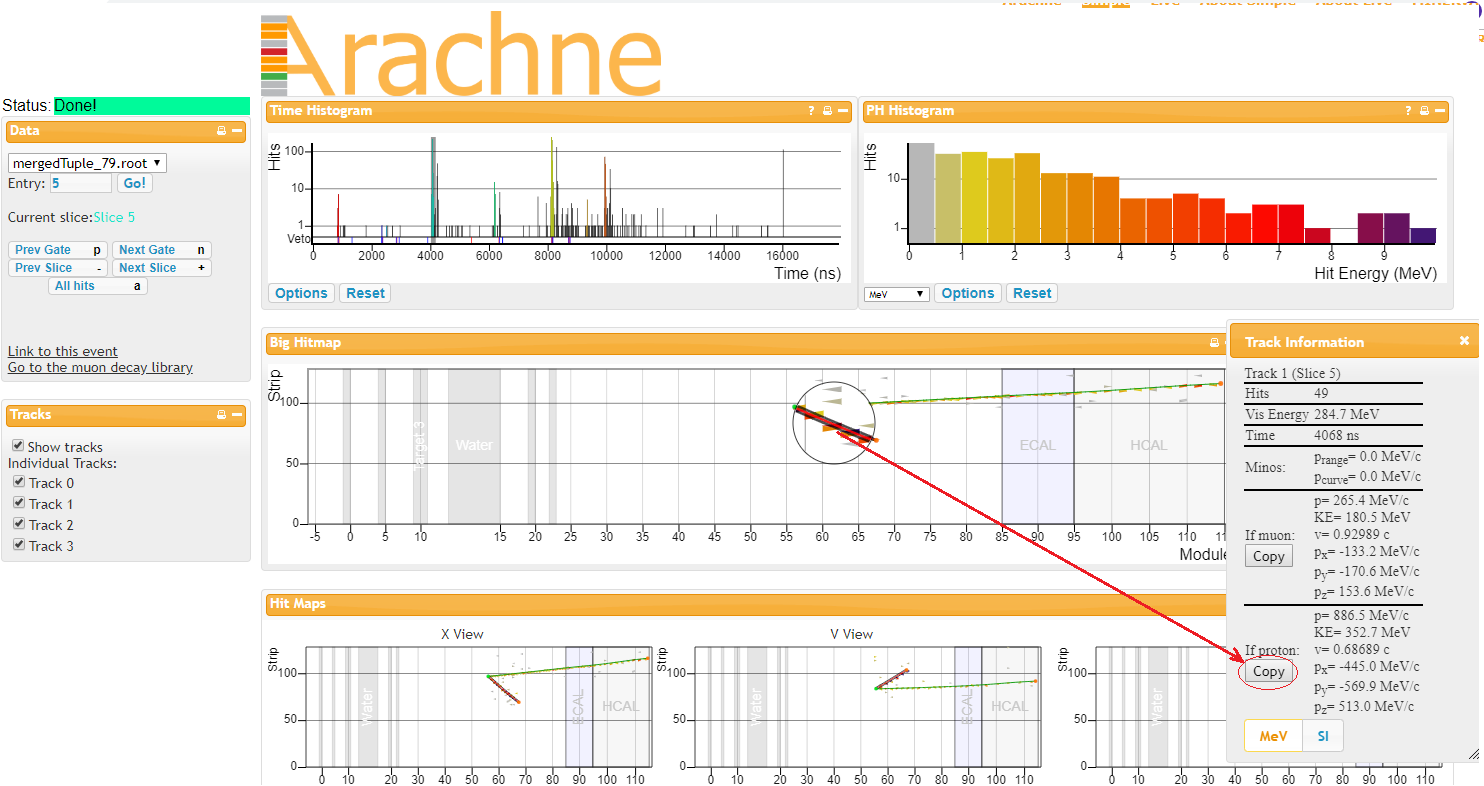
Now the students can find the kinematics from each track. First, they choose one of the two tracks. Here we picked the long muon track first:
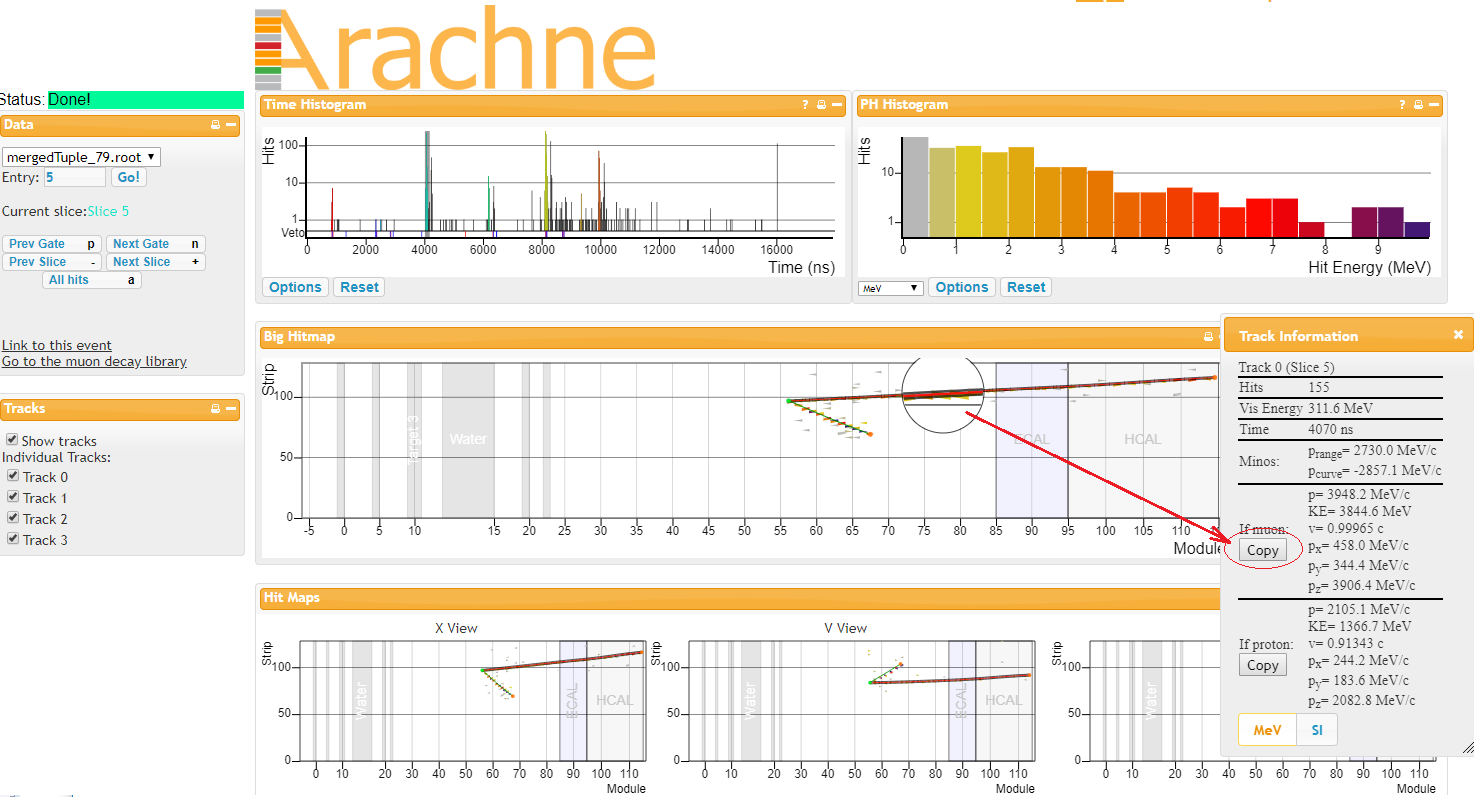
Third step: Enter data into the spreadsheet.
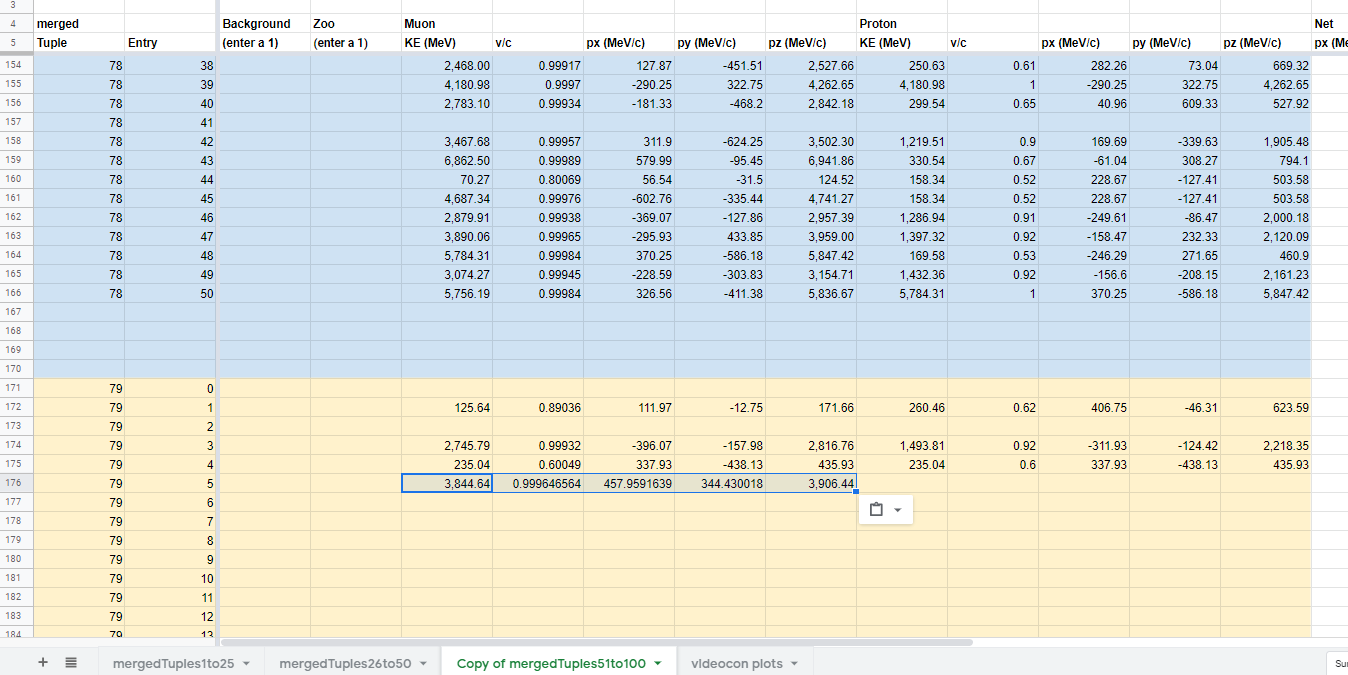
When students choose a track, the Track Information box pops up. Because this is a muon, they choose the Copy button for a muon. This copies the kinematic data for the muon onto the computer clipboard. It is then pasted at the appropriate place in theie assigned Google sheet, in this case in the row for mergedTuple 79, Entry 5 and in the column under Muon KE (MeV):
The students next choose and copy for the proton:
 Then paste the proton kinematics in the next cell to the right of the muon numbers:
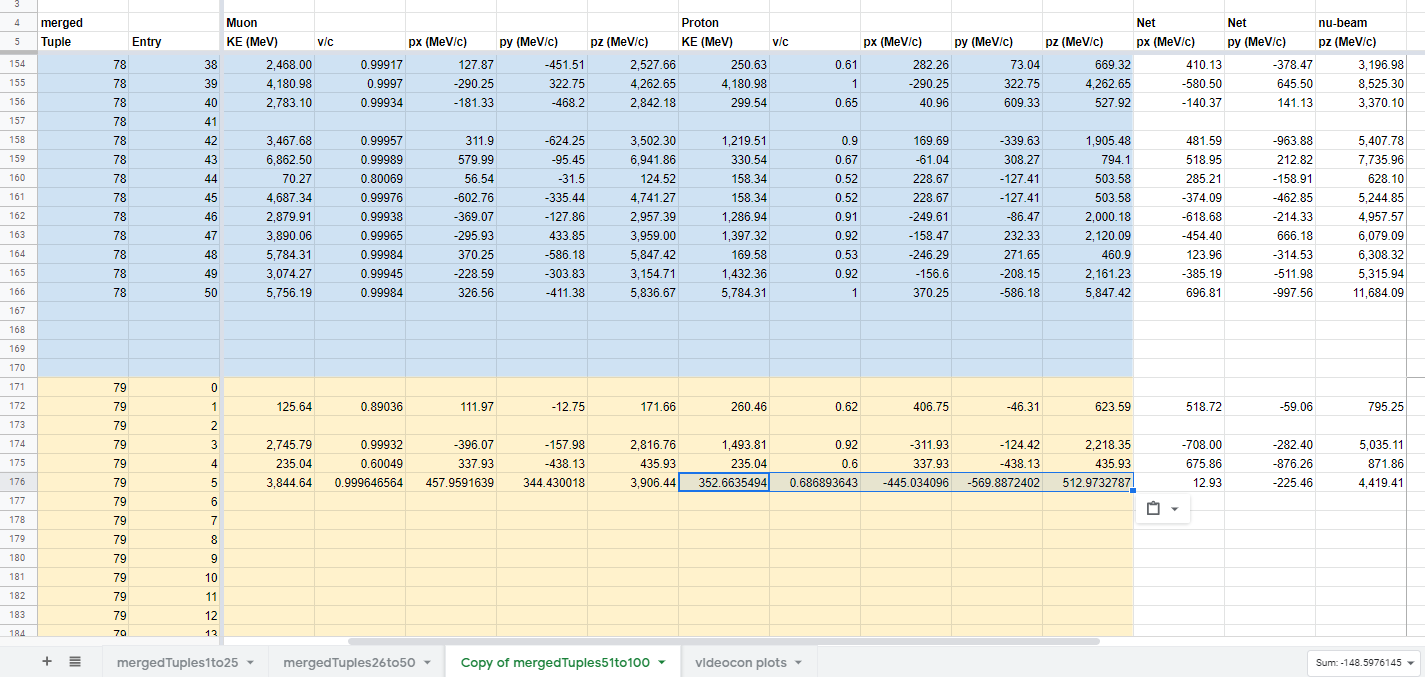
Note that the spreadsheet automatically calculates initial px, py, and pz.
Students do this for all 50 entries (or gates), leaving empty rows only when the gate has no veriable signal event.
About background events
Signal events have a "clean" vertex and undiverted tracks for a proton (short track) and a muon (long track). There may be some splotches of light gray near the vertex; these are low energy deposits in the detector and can usually be ignored.
|
gray to red to blue. |
The two main types of backround event are Vertex and Recoil.
- Vertex background events have ejecta from or near the vertex of the long muon track and short proton track which frustrate an attempt to accurately measure momentum and energy.
- Recoil background events have muon or proton tracks which show signs of having radiated an unseen particle or collided with an unseen particle. The main sign of this would be a track with a "knee" or a "kink" in its path.
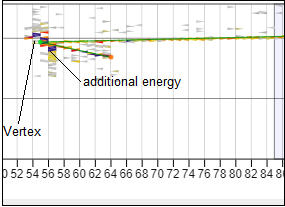
|
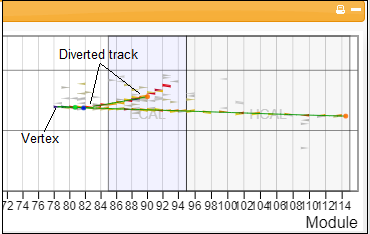
|
In addition, many background events are just outside parameters for a signal event. They may have too many tracks or many "splotches" of significant extra energy or are simply hard to understand. (Physicists usually call these latter kind, if they are odd enough, "zoo" events.)
The good news: students do not need to categorize background events - just skip them!
Presenting and Understanding Results
Masterclass leader must help students to interpret results in a physics discussion after the measurement. We refer you again to Understanding MINERvA Masterclass Results.
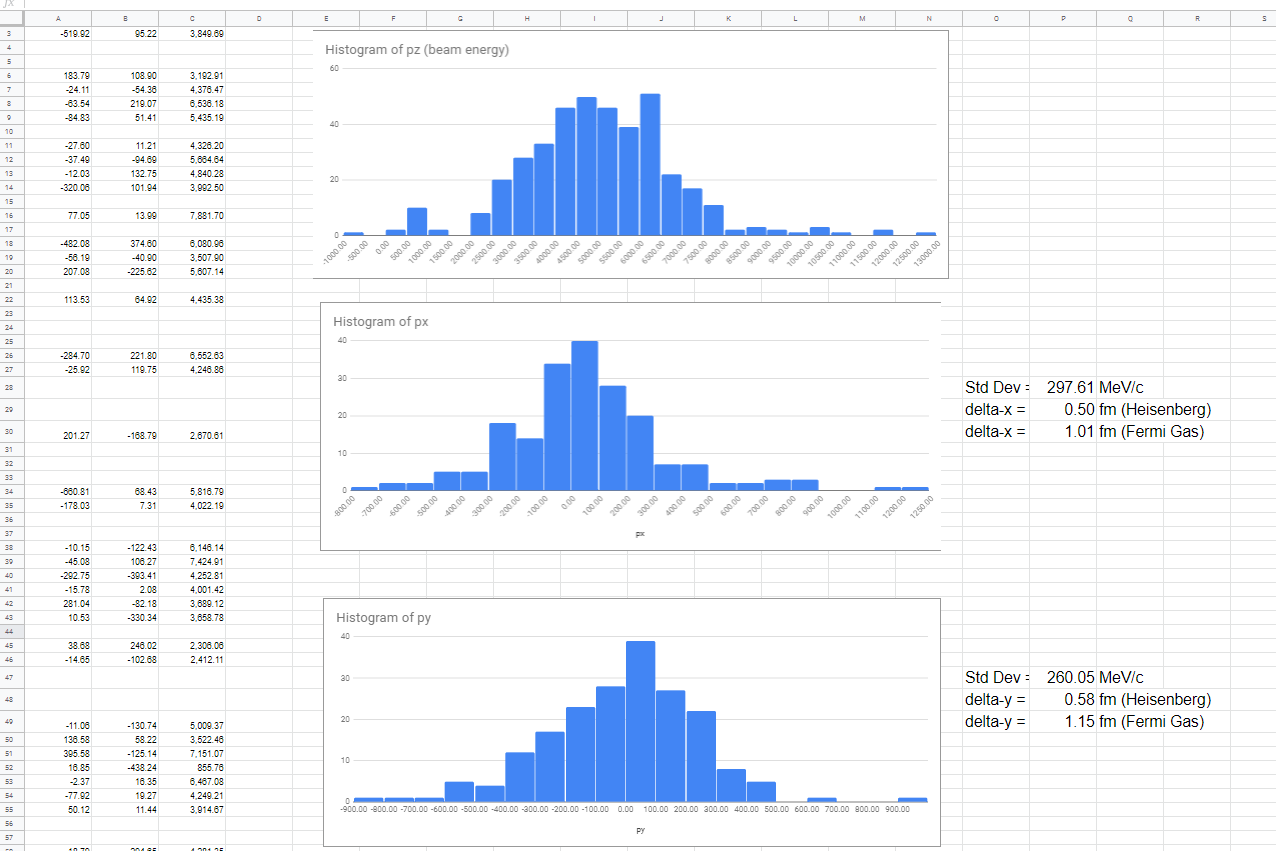
For each masterclass, plots of pz, px, and py for all signal events measured will appear at the bottom of the specific sheet in Google Sheets used by that masterclass. Each plot should be roughly Gaussian. Masterclass leaders should guide students to these 3 discoveries:
- The central value in the pz plot represents the beam momentum. Since each neutrino has very little mass but significant-enough momentum to be relativistic, pz in MeV/c is effectively the same number as energy E of the neutrino beam. If nothing else, the students will leave the mastecrclass knowing the MINOS neutrino line beam energy becuase they will have measured it.
- The values of px and py represent neutron momenta in the x- and y-directions, transverse to the neutrino beam. If these cluster narrowly around zero, then the neutrons are at rest when they interact with the neutrinos. If there is more like a Gaussian distribution, they hav etheir own momenta inside the nucleus. Thus students can conclude from a robust distribution that the neutrons do indeed have their own momenta - and thus motion - inside the nucleus.
- The widths of the distributions in px and py represent two meaurements of the uncertainty in the momentum of the neutron inside the carbon nucleus. Application of the Heisenburg Uncertainty Principle will then yield the uncertainty in position. An adjustment for the neutrinos behaving approximately as a Fermi gas doubles this number. This is the uncertainty in the position of the neutron and should be on a scale similar to the radius of a carbon nucleus.
The plots should appear at the top of the sheet to the right of of the data and look something like this:
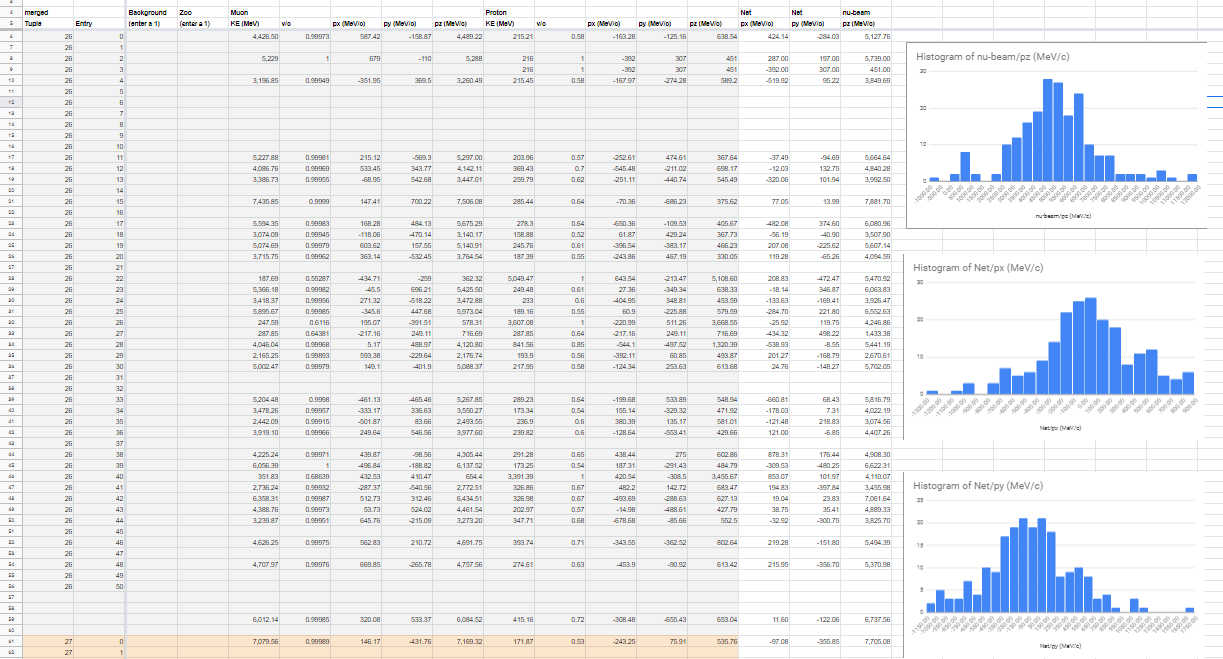
For px and py, the uncertainties can be roughly measure as the full-width at half-maximum of the plot.divided by 2. Students and masterclass leaders are asked to measure these from the plots and enter these into the Google sheets just below those plots.. The Google sheet will then make the cal
Much MINERvA research is dedicated to understanding the full interaction - νμ + n0 → μ- + p+ plus whatever interactions the muon and the proton have with other parts of the nucleus as they energy.
Moderators
Fermilab-based moderators should refer to the FNAL Masterclass Moderators page.
All moderators should note the following:
- The videoconference should last about 30 minutes. It sometimes runs over but be careful to not use up too much time, especially in the first half. Keep answers and explanations brief and to the point. Do not veer off into details or additional related physics.
- If there is only one masterclass group assigned to the videoconference, there is no need for combination of results. Rather, allow the single group to explain their results to you; ask probing and encouraging questions.
- If there is more than one group, still allow each group to explain their result but limit it to only 1-3 minutes. Ask questions.
- Combination plots are in the "videocon plots" tab of the Google Sheet. The spreadsheet calculates standard deviation for the px and py plots as well as Δpx, Δx. Δpy, and Δy. Please discuss these results with the students and compare them with the results for a single group. Ask more questions.
- The last part of the videoconference is for students to ask questions of you. Be sure there will be time for this. They are instructed to be wide-ranging in their questions.
The plots and calculations look like this:
References and materials
- MINERvA (Fermilab) page
- International Masterclasses
- QuarkNet (for Neutrino Masterclass Library, go to MASTERCLASSES > NEUTRINO PROJECT MAP)
- Useful Wikipedia pages:
- All the data:
- mergedTuples 1-25
- mergedTuples 26-50
- mergedTuples 51-75
- mergedTuples 76-100
- mergedTuples 101-125
- mergedTuples 126-150
- mergedTuples 151-175
- practiceTuples (includes teacherTuple and Archive)